33
/es/
AIzaSyAYiBZKx7MnpbEhh9jyipgxe19OcubqV5w
May 1, 2025
81595
Belgium
BEL
true
2
1
Current education expenditure, tertiary (% of total expenditure in tertiary public institutions)
2013,2012,2011,2010,2009,2008,2007,2006,2005,2004,2003,2002
Download
Estadísticas Globales de la Biblioteca →Belgium →

Current education expenditure, tertiary (% of total expenditure in tertiary public institutions)

Estas estadísticas en otros países:

AlbaniaAmerican SamoaAndorraAngolaAntigua and BarbudaArgentinaArmeniaArubaAustraliaAustriaAzerbaijanBangladeshBarbadosBelarusBelgiumBelizeBeninBermudaBoliviaBotswanaBrazilBritish Virgin IslandsBulgariaBurkina FasoBurundiCabo VerdeCameroonCanadaCaribbean small statesCentral African RepublicCentral Europe and the BalticsChadChileChinaColombiaComorosCongo, Dem. Rep.Congo, Rep.Cote d'IvoireCroatiaCubaCuracaoCyprusCzech RepublicDenmarkDominican RepublicEcuadorEl SalvadorEritreaEstoniaEthiopiaEuro areaEurope & Central AsiaEurope & Central Asia (excluding high income)Europe & Central Asia (IDA & IBRD countries)European UnionFinlandFranceGambia, TheGermanyGhanaGreeceGrenadaGuatemalaGuineaGuinea-BissauGuyanaHeavily indebted poor countries (HIPC)High incomeHondurasHong Kong SAR, ChinaHungaryIcelandIndiaIndonesiaIran, Islamic Rep.IrelandIsraelItalyJamaicaJapanJordanKazakhstanKorea, Rep.KuwaitKyrgyz RepublicLate-demographic dividendLatin America & Caribbean Latin America & Caribbean (excluding high income)Latin America & the Caribbean (IDA & IBRD countries)LatviaLebanonLesothoLithuaniaLow incomeMacao SAR, ChinaMacedonia, FYRMadagascarMalawiMalaysiaMaldivesMaliMaltaMauritiusMexicoMoldovaMongoliaMoroccoMozambiqueNamibiaNetherlandsNicaraguaNigerNorth AmericaNorwayOECD membersOmanPakistanPanamaParaguayPeruPhilippinesPolandPortugalPost-demographic dividendPuerto RicoRomaniaRussian FederationRwandaSenegalSerbiaSeychellesSierra LeoneSingaporeSlovak RepublicSloveniaSouth AfricaSpainSri LankaSt. Kitts and NevisSt. LuciaSt. Vincent and the GrenadinesSwedenSwitzerlandTajikistanThailandTimor-LesteTogoTunisiaTurkeyTurkmenistanTurks and Caicos IslandsUgandaUkraineUnited StatesUruguayVenezuela, RBVietnamWorldZambiaZimbabwe

línea de tiempo (timeline):

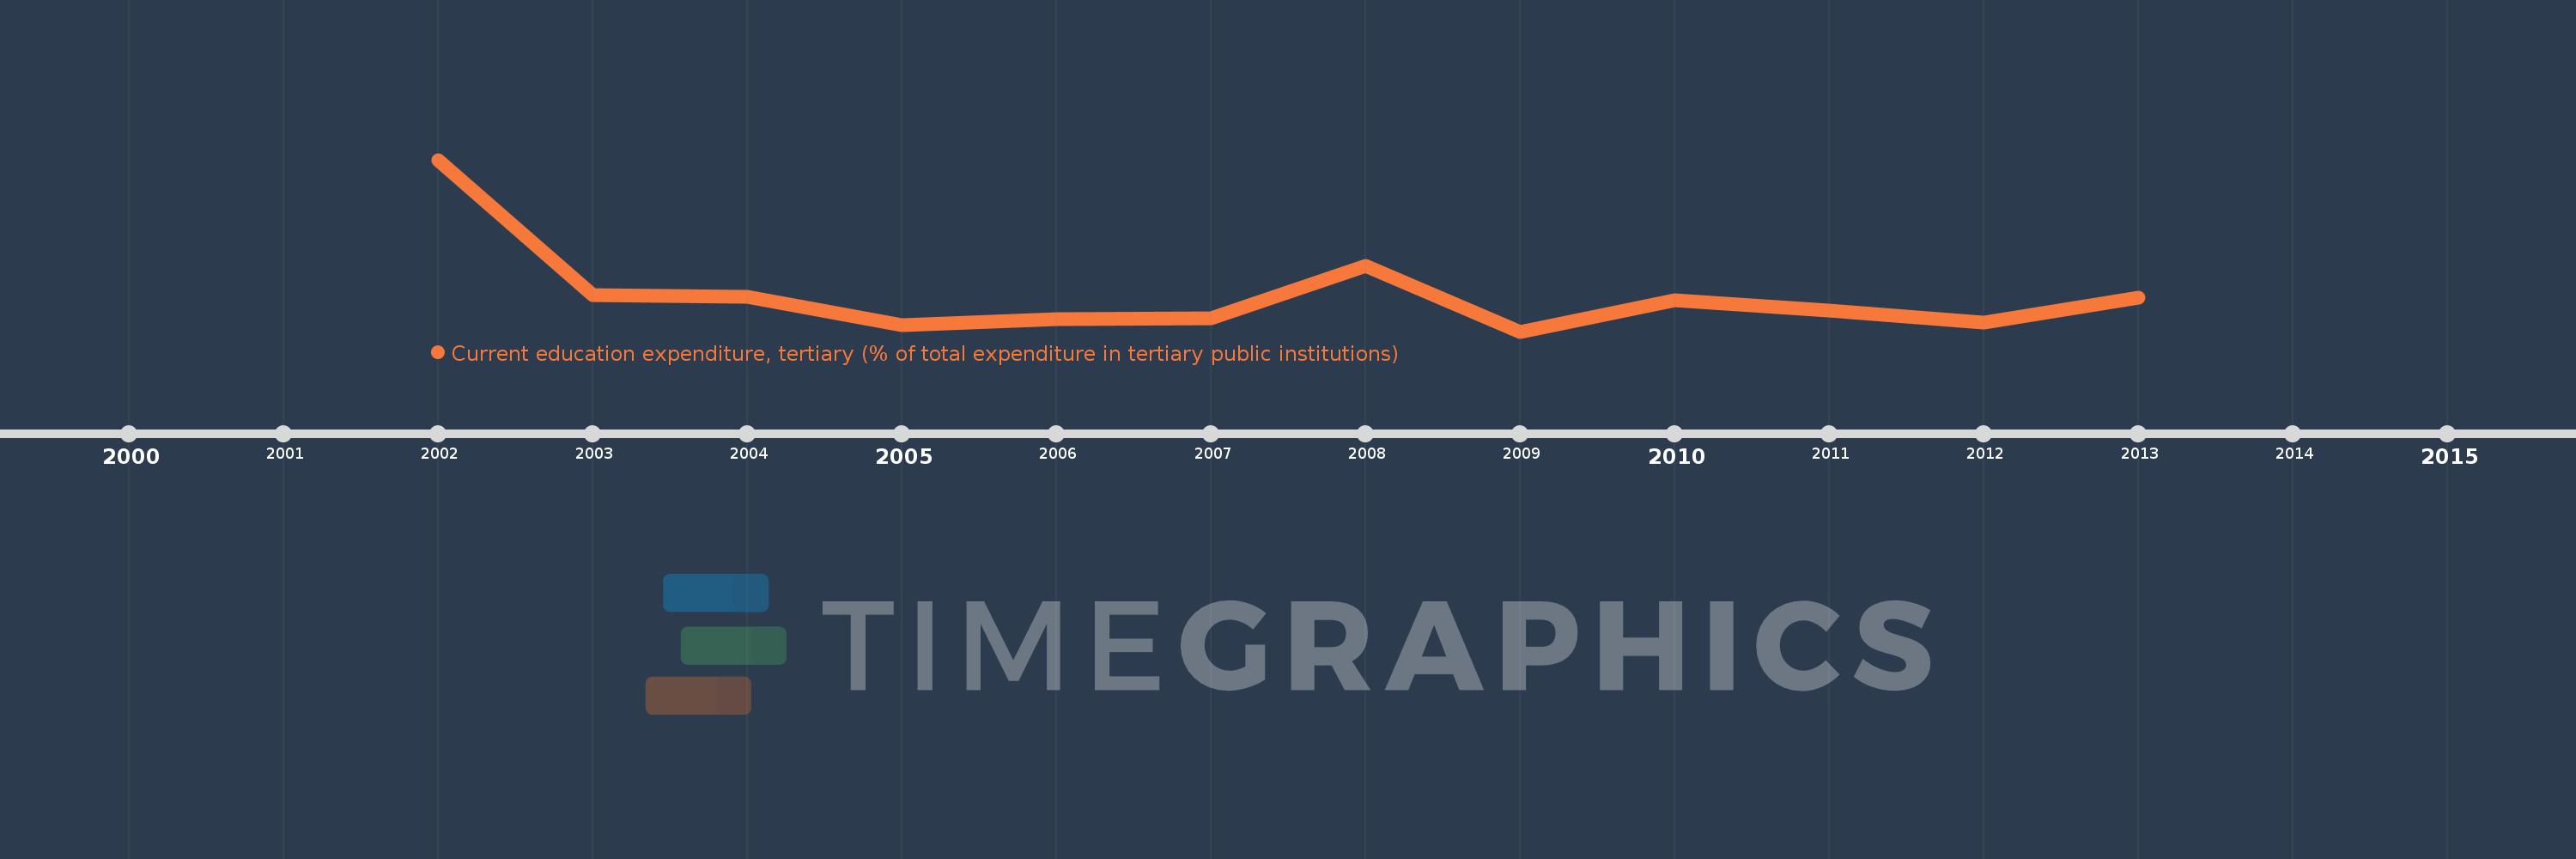
En esta escala de tiempo se presenta un gráfico de 2002 y 2013 de Belgium. Los datos de 2001 están ausentes. El número de observaciones reales por fecha: 12.

Fuente (nombre):

Indicadores del desarrollo mundial

Fuente (organización):

United Nations Educational, Scientific, and Cultural Organization (UNESCO) Institute for Statistics.

Categorías:

Education

Se ha actualizado:

23 abr 2017 año

Los indicadores de los cambios de valor en los últimos años

En promedio:
97.065
Mínimo:
96.92
1 ene 2009 año
Máximo:
97.606
1 ene 2002 año
A la fecha de observación
Valor
Cambio absoluto
El cambio con respecto al valor anterior
1 ene 2002 año
97.606
+97.606
0.0%
1 ene 2003 año
97.065
-0.541
-0.55%
1 ene 2004 año
97.058
-0.006
-0.01%
1 ene 2005 año
96.947
-0.111
-0.11%
1 ene 2006 año
96.969
+0.022
0.02%
1 ene 2007 año
96.973
+0.004
0.0%
1 ene 2008 año
97.183
+0.21
0.22%
1 ene 2009 año
96.92
-0.263
-0.27%
1 ene 2010 año
97.046
+0.126
0.13%
1 ene 2011 año
97.004
-0.042
-0.04%
1 ene 2012 año
96.957
-0.047
-0.05%
1 ene 2013 año
97.055
+0.098
0.1%

Ranking de los países por los datos estadísticos actuales