33
/es/
AIzaSyAYiBZKx7MnpbEhh9jyipgxe19OcubqV5w
August 1, 2025
165968
Kazakhstan
KAZ
true
2
1
Current education expenditure, tertiary (% of total expenditure in tertiary public institutions)
2015,2014,2013,2012,2011,2010,2009,2008,2007,2006,2005,2003
Download
Estadísticas Globales de la Biblioteca →Kazakhstan →

Current education expenditure, tertiary (% of total expenditure in tertiary public institutions)

Estas estadísticas en otros países:

AlbaniaAmerican SamoaAndorraAngolaAntigua and BarbudaArgentinaArmeniaArubaAustraliaAustriaAzerbaijanBangladeshBarbadosBelarusBelgiumBelizeBeninBermudaBoliviaBotswanaBrazilBritish Virgin IslandsBulgariaBurkina FasoBurundiCabo VerdeCameroonCanadaCaribbean small statesCentral African RepublicCentral Europe and the BalticsChadChileChinaColombiaComorosCongo, Dem. Rep.Congo, Rep.Cote d'IvoireCroatiaCubaCuracaoCyprusCzech RepublicDenmarkDominican RepublicEcuadorEl SalvadorEritreaEstoniaEthiopiaEuro areaEurope & Central AsiaEurope & Central Asia (excluding high income)Europe & Central Asia (IDA & IBRD countries)European UnionFinlandFranceGambia, TheGermanyGhanaGreeceGrenadaGuatemalaGuineaGuinea-BissauGuyanaHeavily indebted poor countries (HIPC)High incomeHondurasHong Kong SAR, ChinaHungaryIcelandIndiaIndonesiaIran, Islamic Rep.IrelandIsraelItalyJamaicaJapanJordanKazakhstanKorea, Rep.KuwaitKyrgyz RepublicLate-demographic dividendLatin America & Caribbean Latin America & Caribbean (excluding high income)Latin America & the Caribbean (IDA & IBRD countries)LatviaLebanonLesothoLithuaniaLow incomeMacao SAR, ChinaMacedonia, FYRMadagascarMalawiMalaysiaMaldivesMaliMaltaMauritiusMexicoMoldovaMongoliaMoroccoMozambiqueNamibiaNetherlandsNicaraguaNigerNorth AmericaNorwayOECD membersOmanPakistanPanamaParaguayPeruPhilippinesPolandPortugalPost-demographic dividendPuerto RicoRomaniaRussian FederationRwandaSenegalSerbiaSeychellesSierra LeoneSingaporeSlovak RepublicSloveniaSouth AfricaSpainSri LankaSt. Kitts and NevisSt. LuciaSt. Vincent and the GrenadinesSwedenSwitzerlandTajikistanThailandTimor-LesteTogoTunisiaTurkeyTurkmenistanTurks and Caicos IslandsUgandaUkraineUnited StatesUruguayVenezuela, RBVietnamWorldZambiaZimbabwe

línea de tiempo (timeline):

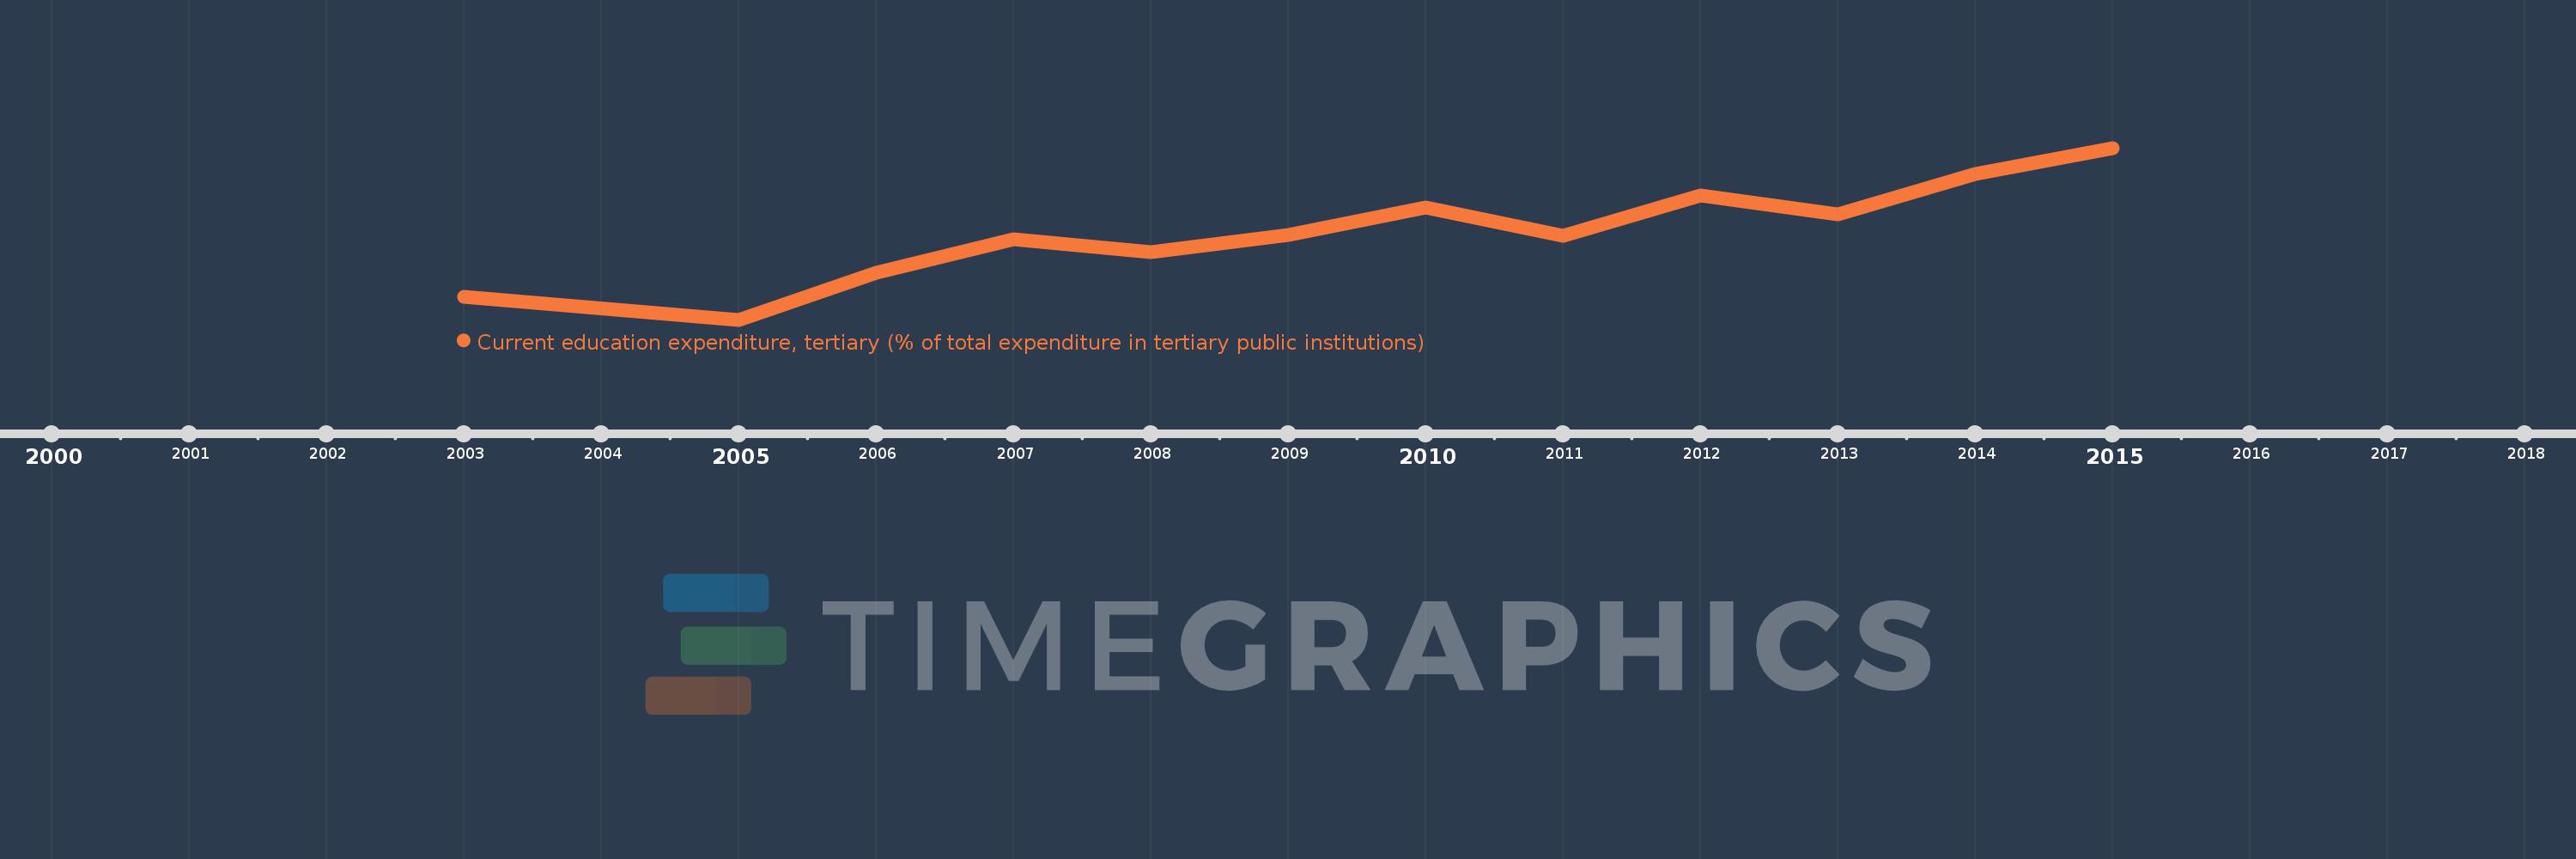
En esta escala de tiempo se presenta un gráfico de 2003 y 2015 de Kazakhstan. Los datos de 2002 están ausentes. El número de observaciones reales por fecha: 12.

Fuente (nombre):

Indicadores del desarrollo mundial

Fuente (organización):

United Nations Educational, Scientific, and Cultural Organization (UNESCO) Institute for Statistics.

Categorías:

Education

Se ha actualizado:

23 abr 2017 año

Los indicadores de los cambios de valor en los últimos años

En promedio:
86.73
Mínimo:
77.459
1 ene 2005 año
Máximo:
95.73
1 ene 2015 año
A la fecha de observación
Valor
Cambio absoluto
El cambio con respecto al valor anterior
1 ene 2003 año
79.906
+79.906
0.0%
1 ene 2005 año
77.459
-2.446
-3.06%
1 ene 2006 año
82.461
+5.002
6.46%
1 ene 2007 año
85.978
+3.517
4.26%
1 ene 2008 año
84.603
-1.375
-1.6%
1 ene 2009 año
86.513
+1.91
2.26%
1 ene 2010 año
89.394
+2.881
3.33%
1 ene 2011 año
86.361
-3.034
-3.39%
1 ene 2012 año
90.694
+4.333
5.02%
1 ene 2013 año
88.708
-1.986
-2.19%
1 ene 2014 año
92.953
+4.245
4.79%
1 ene 2015 año
95.73
+2.776
2.99%

Ranking de los países por los datos estadísticos actuales