33
/es/
AIzaSyAYiBZKx7MnpbEhh9jyipgxe19OcubqV5w
May 1, 2025
161320
Italy
ITA
true
2
1
Current education expenditure, tertiary (% of total expenditure in tertiary public institutions)
2012,2011,2010,2009,2008,2007,2006,2005,2004,2003,2002,2001,1999
Download
Estadísticas Globales de la Biblioteca →Italy →

Current education expenditure, tertiary (% of total expenditure in tertiary public institutions)

Estas estadísticas en otros países:

AlbaniaAmerican SamoaAndorraAngolaAntigua and BarbudaArgentinaArmeniaArubaAustraliaAustriaAzerbaijanBangladeshBarbadosBelarusBelgiumBelizeBeninBermudaBoliviaBotswanaBrazilBritish Virgin IslandsBulgariaBurkina FasoBurundiCabo VerdeCameroonCanadaCaribbean small statesCentral African RepublicCentral Europe and the BalticsChadChileChinaColombiaComorosCongo, Dem. Rep.Congo, Rep.Cote d'IvoireCroatiaCubaCuracaoCyprusCzech RepublicDenmarkDominican RepublicEcuadorEl SalvadorEritreaEstoniaEthiopiaEuro areaEurope & Central AsiaEurope & Central Asia (excluding high income)Europe & Central Asia (IDA & IBRD countries)European UnionFinlandFranceGambia, TheGermanyGhanaGreeceGrenadaGuatemalaGuineaGuinea-BissauGuyanaHeavily indebted poor countries (HIPC)High incomeHondurasHong Kong SAR, ChinaHungaryIcelandIndiaIndonesiaIran, Islamic Rep.IrelandIsraelItalyJamaicaJapanJordanKazakhstanKorea, Rep.KuwaitKyrgyz RepublicLate-demographic dividendLatin America & Caribbean Latin America & Caribbean (excluding high income)Latin America & the Caribbean (IDA & IBRD countries)LatviaLebanonLesothoLithuaniaLow incomeMacao SAR, ChinaMacedonia, FYRMadagascarMalawiMalaysiaMaldivesMaliMaltaMauritiusMexicoMoldovaMongoliaMoroccoMozambiqueNamibiaNetherlandsNicaraguaNigerNorth AmericaNorwayOECD membersOmanPakistanPanamaParaguayPeruPhilippinesPolandPortugalPost-demographic dividendPuerto RicoRomaniaRussian FederationRwandaSenegalSerbiaSeychellesSierra LeoneSingaporeSlovak RepublicSloveniaSouth AfricaSpainSri LankaSt. Kitts and NevisSt. LuciaSt. Vincent and the GrenadinesSwedenSwitzerlandTajikistanThailandTimor-LesteTogoTunisiaTurkeyTurkmenistanTurks and Caicos IslandsUgandaUkraineUnited StatesUruguayVenezuela, RBVietnamWorldZambiaZimbabwe

línea de tiempo (timeline):

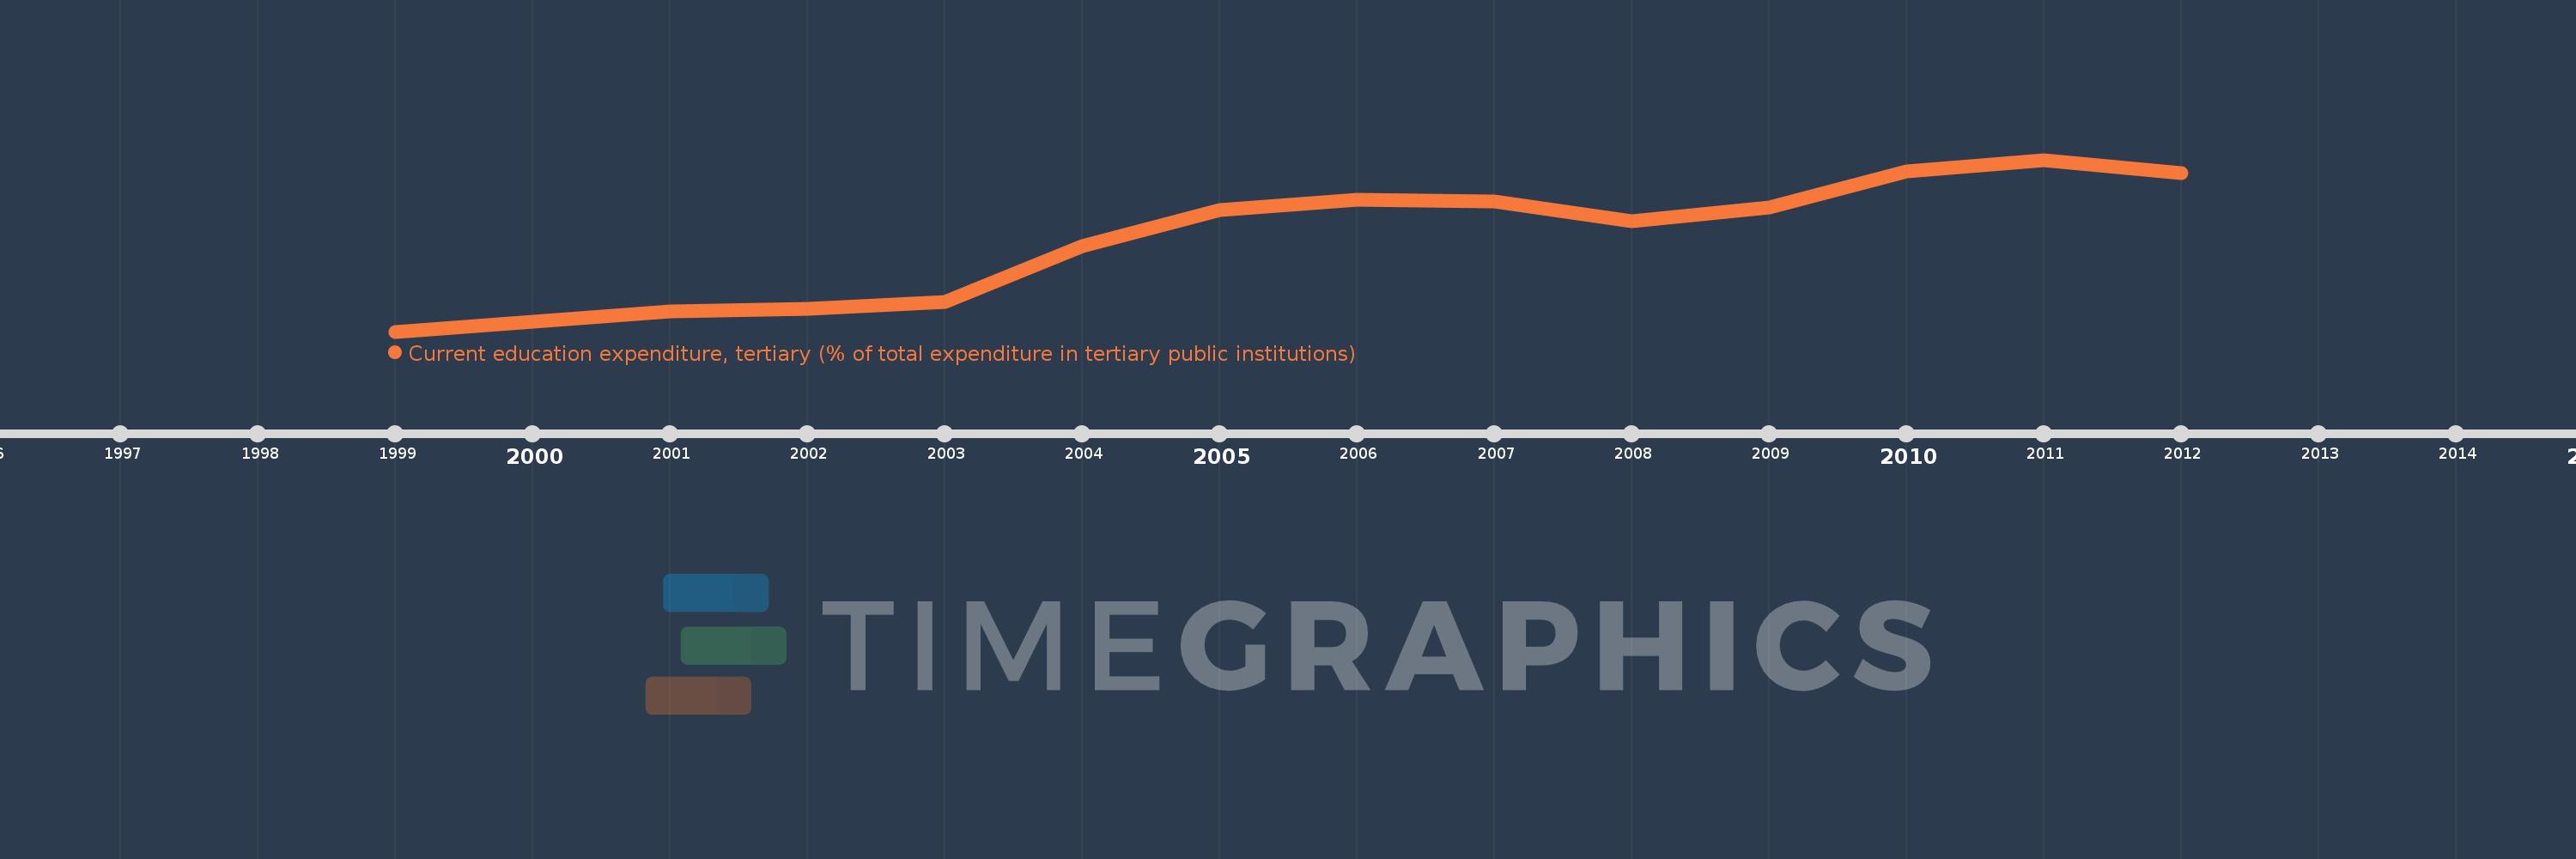
En esta escala de tiempo se presenta un gráfico de 1999 y 2012 de Italy. Los datos de 1998 están ausentes. El número de observaciones reales por fecha: 13.

Fuente (nombre):

Indicadores del desarrollo mundial

Fuente (organización):

United Nations Educational, Scientific, and Cultural Organization (UNESCO) Institute for Statistics.

Categorías:

Education

Se ha actualizado:

23 abr 2017 año

Los indicadores de los cambios de valor en los últimos años

En promedio:
87.365
Mínimo:
81.689
1 ene 1999 año
Máximo:
91.711
1 ene 2011 año
A la fecha de observación
Valor
Cambio absoluto
El cambio con respecto al valor anterior
1 ene 1999 año
81.689
+81.689
0.0%
1 ene 2001 año
82.849
+1.16
1.42%
1 ene 2002 año
83.028
+0.179
0.22%
1 ene 2003 año
83.397
+0.369
0.45%
1 ene 2004 año
86.651
+3.254
3.9%
1 ene 2005 año
88.77
+2.119
2.45%
1 ene 2006 año
89.356
+0.585
0.66%
1 ene 2007 año
89.269
-0.087
-0.1%
1 ene 2008 año
88.147
-1.122
-1.26%
1 ene 2009 año
88.932
+0.785
0.89%
1 ene 2010 año
91.028
+2.096
2.36%
1 ene 2011 año
91.711
+0.683
0.75%
1 ene 2012 año
90.915
-0.796
-0.87%

Ranking de los países por los datos estadísticos actuales