33
/es/
AIzaSyAYiBZKx7MnpbEhh9jyipgxe19OcubqV5w
August 1, 2025
80587
Belarus
BLR
true
2
1
Gross domestic savings (current US$)
2016,2015,2014,2013,2012,2011,2010,2009,2008,2007,2006,2005,2004,2003,2002,2001,2000,1999,1998,1997,1996,1995,1994,1993,1992,1991
Download
Estadísticas Globales de la Biblioteca →Belarus →

Gross domestic savings (current US$)

Estas estadísticas en otros países:

AfghanistanAlbaniaAlgeriaAngolaAntigua and BarbudaArab WorldArgentinaArmeniaArubaAustraliaAustriaAzerbaijanBahamas, TheBahrainBangladeshBarbadosBelarusBelgiumBelizeBeninBermudaBhutanBoliviaBosnia and HerzegovinaBotswanaBrazilBrunei DarussalamBulgariaBurkina FasoBurundiCabo VerdeCambodiaCameroonCanadaCaribbean small statesCentral African RepublicCentral Europe and the BalticsChadChileChinaColombiaComorosCongo, Dem. Rep.Congo, Rep.Costa RicaCote d'IvoireCroatiaCubaCyprusCzech RepublicDenmarkDjiboutiDominicaDominican RepublicEarly-demographic dividendEast Asia & PacificEast Asia & Pacific (excluding high income)East Asia & Pacific (IDA & IBRD countries)EcuadorEgypt, Arab Rep.El SalvadorEquatorial GuineaEritreaEstoniaEthiopiaEuro areaEurope & Central AsiaEurope & Central Asia (excluding high income)Europe & Central Asia (IDA & IBRD countries)European UnionFaroe IslandsFijiFinlandFragile and conflict affected situationsFranceGabonGambia, TheGeorgiaGermanyGhanaGreeceGrenadaGuatemalaGuineaGuinea-BissauGuyanaHaitiHeavily indebted poor countries (HIPC)High incomeHondurasHong Kong SAR, ChinaHungaryIBRD onlyIcelandIDA & IBRD totalIDA blendIDA onlyIDA totalIndiaIndonesiaIran, Islamic Rep.IraqIrelandIsraelItalyJamaicaJapanJordanKazakhstanKenyaKiribatiKorea, Rep.KosovoKuwaitKyrgyz RepublicLao PDRLate-demographic dividendLatin America & Caribbean Latin America & Caribbean (excluding high income)Latin America & the Caribbean (IDA & IBRD countries)LatviaLeast developed countries: UN classificationLebanonLesothoLiberiaLibyaLithuaniaLow & middle incomeLow incomeLower middle incomeLuxembourgMacao SAR, ChinaMacedonia, FYRMadagascarMalawiMalaysiaMaldivesMaliMaltaMauritaniaMauritiusMexicoMicronesia, Fed. Sts.Middle East & North AfricaMiddle East & North Africa (excluding high income)Middle East & North Africa (IDA & IBRD countries)Middle incomeMoldovaMongoliaMontenegroMoroccoMozambiqueNamibiaNepalNetherlandsNew CaledoniaNew ZealandNicaraguaNigerNigeriaNorth AmericaNorwayOECD membersOmanOther small statesPakistanPanamaPapua New GuineaParaguayPeruPhilippinesPolandPortugalPost-demographic dividendPre-demographic dividendPuerto RicoQatarRomaniaRussian FederationRwandaSaudi ArabiaSenegalSerbiaSeychellesSierra LeoneSingaporeSlovak RepublicSloveniaSmall statesSolomon IslandsSouth AfricaSouth AsiaSouth Asia (IDA & IBRD)South SudanSpainSri LankaSt. Kitts and NevisSt. LuciaSt. Vincent and the GrenadinesSub-Saharan Africa Sub-Saharan Africa (excluding high income)Sub-Saharan Africa (IDA & IBRD countries)SudanSurinameSwazilandSwedenSwitzerlandSyrian Arab RepublicTajikistanTanzaniaThailandTimor-LesteTogoTongaTrinidad and TobagoTunisiaTurkeyTurkmenistanUgandaUkraineUnited Arab EmiratesUnited KingdomUnited StatesUpper middle incomeUruguayUzbekistanVanuatuVenezuela, RBVietnamWest Bank and GazaWorldYemen, Rep.ZambiaZimbabwe

línea de tiempo (timeline):

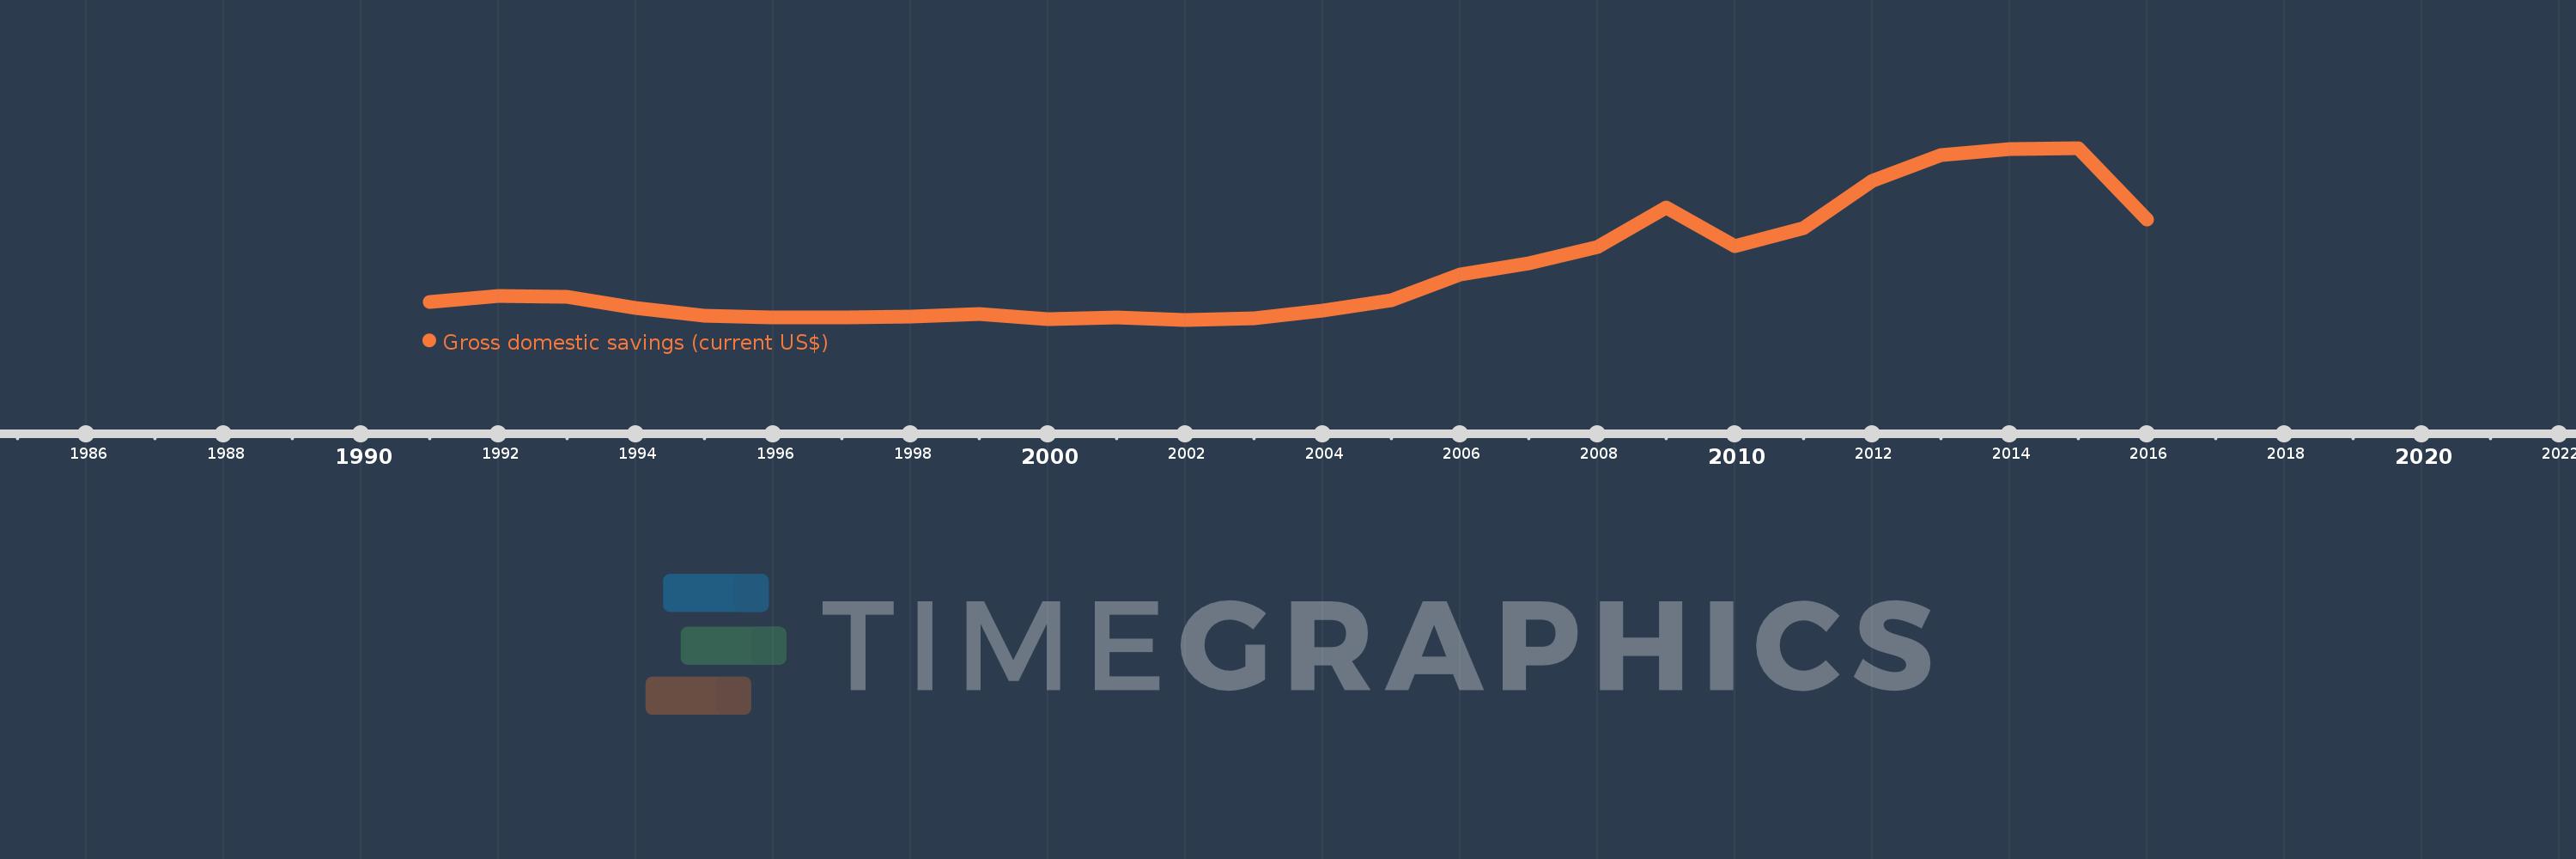
En esta escala de tiempo se presenta un gráfico de 1991 y 2016 de Belarus. Los datos de 1990 están ausentes. El número de observaciones reales por fecha: 26.

Fuente (nombre):

Indicadores del desarrollo mundial

Fuente (organización):

World Bank national accounts data, and OECD National Accounts data files.

Categorías:

Economy & Growth

Se ha actualizado:

23 abr 2017 año

Los indicadores de los cambios de valor en los últimos años

En promedio:
9.602 bn
Mínimo:
2.497 bn
1 ene 2002 año
Máximo:
26.459 bn
1 ene 2015 año
A la fecha de observación
Valor
Cambio absoluto
El cambio con respecto al valor anterior
1 ene 1991 año
5.006 bn
+5.006 bn
0.0%
1 ene 1992 año
5.788 bn
+781.522 millones
15.61%
1 ene 1993 año
5.658 bn
-129.531 millones
-2.24%
1 ene 1994 año
4.119 bn
-1.539 bn
-27.2%
1 ene 1995 año
3.001 bn
-1.118 bn
-27.13%
1 ene 1996 año
2.845 bn
-156.388 millones
-5.21%
1 ene 1997 año
2.869 bn
+24.232 millones
0.85%
1 ene 1998 año
2.973 bn
+103.328 millones
3.6%
1 ene 1999 año
3.327 bn
+354.339 millones
11.92%
1 ene 2000 año
2.583 bn
-744.135 millones
-22.37%
1 ene 2001 año
2.829 bn
+246.132 millones
9.53%
1 ene 2002 año
2.497 bn
-331.952 millones
-11.73%
1 ene 2003 año
2.69 bn
+192.769 millones
7.72%
1 ene 2004 año
3.766 bn
+1.076 bn
40.0%
1 ene 2005 año
5.161 bn
+1.396 bn
37.06%
1 ene 2006 año
8.813 bn
+3.651 bn
70.75%
1 ene 2007 año
10.354 bn
+1.541 bn
17.48%
1 ene 2008 año
12.598 bn
+2.244 bn
21.67%
1 ene 2009 año
18.176 bn
+5.578 bn
44.28%
1 ene 2010 año
12.806 bn
-5.37 bn
-29.54%
1 ene 2011 año
15.23 bn
+2.424 bn
18.93%
1 ene 2012 año
21.828 bn
+6.598 bn
43.32%
1 ene 2013 año
25.443 bn
+3.615 bn
16.56%
1 ene 2014 año
26.349 bn
+906.389 millones
3.56%
1 ene 2015 año
26.459 bn
+109.764 millones
0.42%
1 ene 2016 año
16.49 bn
-9.969 bn
-37.68%

Ranking de los países por los datos estadísticos actuales