33
/es/
AIzaSyAYiBZKx7MnpbEhh9jyipgxe19OcubqV5w
May 1, 2025
228533
Romania
ROU
true
2
1
Gross domestic savings (current US$)
2016,2015,2014,2013,2012,2011,2010,2009,2008,2007,2006,2005,2004,2003,2002,2001,2000,1999,1998,1997,1996,1995,1994,1993,1992,1991
Download
Estadísticas Globales de la Biblioteca →Romania →

Gross domestic savings (current US$)

Estas estadísticas en otros países:

AfghanistanAlbaniaAlgeriaAngolaAntigua and BarbudaArab WorldArgentinaArmeniaArubaAustraliaAustriaAzerbaijanBahamas, TheBahrainBangladeshBarbadosBelarusBelgiumBelizeBeninBermudaBhutanBoliviaBosnia and HerzegovinaBotswanaBrazilBrunei DarussalamBulgariaBurkina FasoBurundiCabo VerdeCambodiaCameroonCanadaCaribbean small statesCentral African RepublicCentral Europe and the BalticsChadChileChinaColombiaComorosCongo, Dem. Rep.Congo, Rep.Costa RicaCote d'IvoireCroatiaCubaCyprusCzech RepublicDenmarkDjiboutiDominicaDominican RepublicEarly-demographic dividendEast Asia & PacificEast Asia & Pacific (excluding high income)East Asia & Pacific (IDA & IBRD countries)EcuadorEgypt, Arab Rep.El SalvadorEquatorial GuineaEritreaEstoniaEthiopiaEuro areaEurope & Central AsiaEurope & Central Asia (excluding high income)Europe & Central Asia (IDA & IBRD countries)European UnionFaroe IslandsFijiFinlandFragile and conflict affected situationsFranceGabonGambia, TheGeorgiaGermanyGhanaGreeceGrenadaGuatemalaGuineaGuinea-BissauGuyanaHaitiHeavily indebted poor countries (HIPC)High incomeHondurasHong Kong SAR, ChinaHungaryIBRD onlyIcelandIDA & IBRD totalIDA blendIDA onlyIDA totalIndiaIndonesiaIran, Islamic Rep.IraqIrelandIsraelItalyJamaicaJapanJordanKazakhstanKenyaKiribatiKorea, Rep.KosovoKuwaitKyrgyz RepublicLao PDRLate-demographic dividendLatin America & Caribbean Latin America & Caribbean (excluding high income)Latin America & the Caribbean (IDA & IBRD countries)LatviaLeast developed countries: UN classificationLebanonLesothoLiberiaLibyaLithuaniaLow & middle incomeLow incomeLower middle incomeLuxembourgMacao SAR, ChinaMacedonia, FYRMadagascarMalawiMalaysiaMaldivesMaliMaltaMauritaniaMauritiusMexicoMicronesia, Fed. Sts.Middle East & North AfricaMiddle East & North Africa (excluding high income)Middle East & North Africa (IDA & IBRD countries)Middle incomeMoldovaMongoliaMontenegroMoroccoMozambiqueNamibiaNepalNetherlandsNew CaledoniaNew ZealandNicaraguaNigerNigeriaNorth AmericaNorwayOECD membersOmanOther small statesPakistanPanamaPapua New GuineaParaguayPeruPhilippinesPolandPortugalPost-demographic dividendPre-demographic dividendPuerto RicoQatarRomaniaRussian FederationRwandaSaudi ArabiaSenegalSerbiaSeychellesSierra LeoneSingaporeSlovak RepublicSloveniaSmall statesSolomon IslandsSouth AfricaSouth AsiaSouth Asia (IDA & IBRD)South SudanSpainSri LankaSt. Kitts and NevisSt. LuciaSt. Vincent and the GrenadinesSub-Saharan Africa Sub-Saharan Africa (excluding high income)Sub-Saharan Africa (IDA & IBRD countries)SudanSurinameSwazilandSwedenSwitzerlandSyrian Arab RepublicTajikistanTanzaniaThailandTimor-LesteTogoTongaTrinidad and TobagoTunisiaTurkeyTurkmenistanUgandaUkraineUnited Arab EmiratesUnited KingdomUnited StatesUpper middle incomeUruguayUzbekistanVanuatuVenezuela, RBVietnamWest Bank and GazaWorldYemen, Rep.ZambiaZimbabwe

línea de tiempo (timeline):

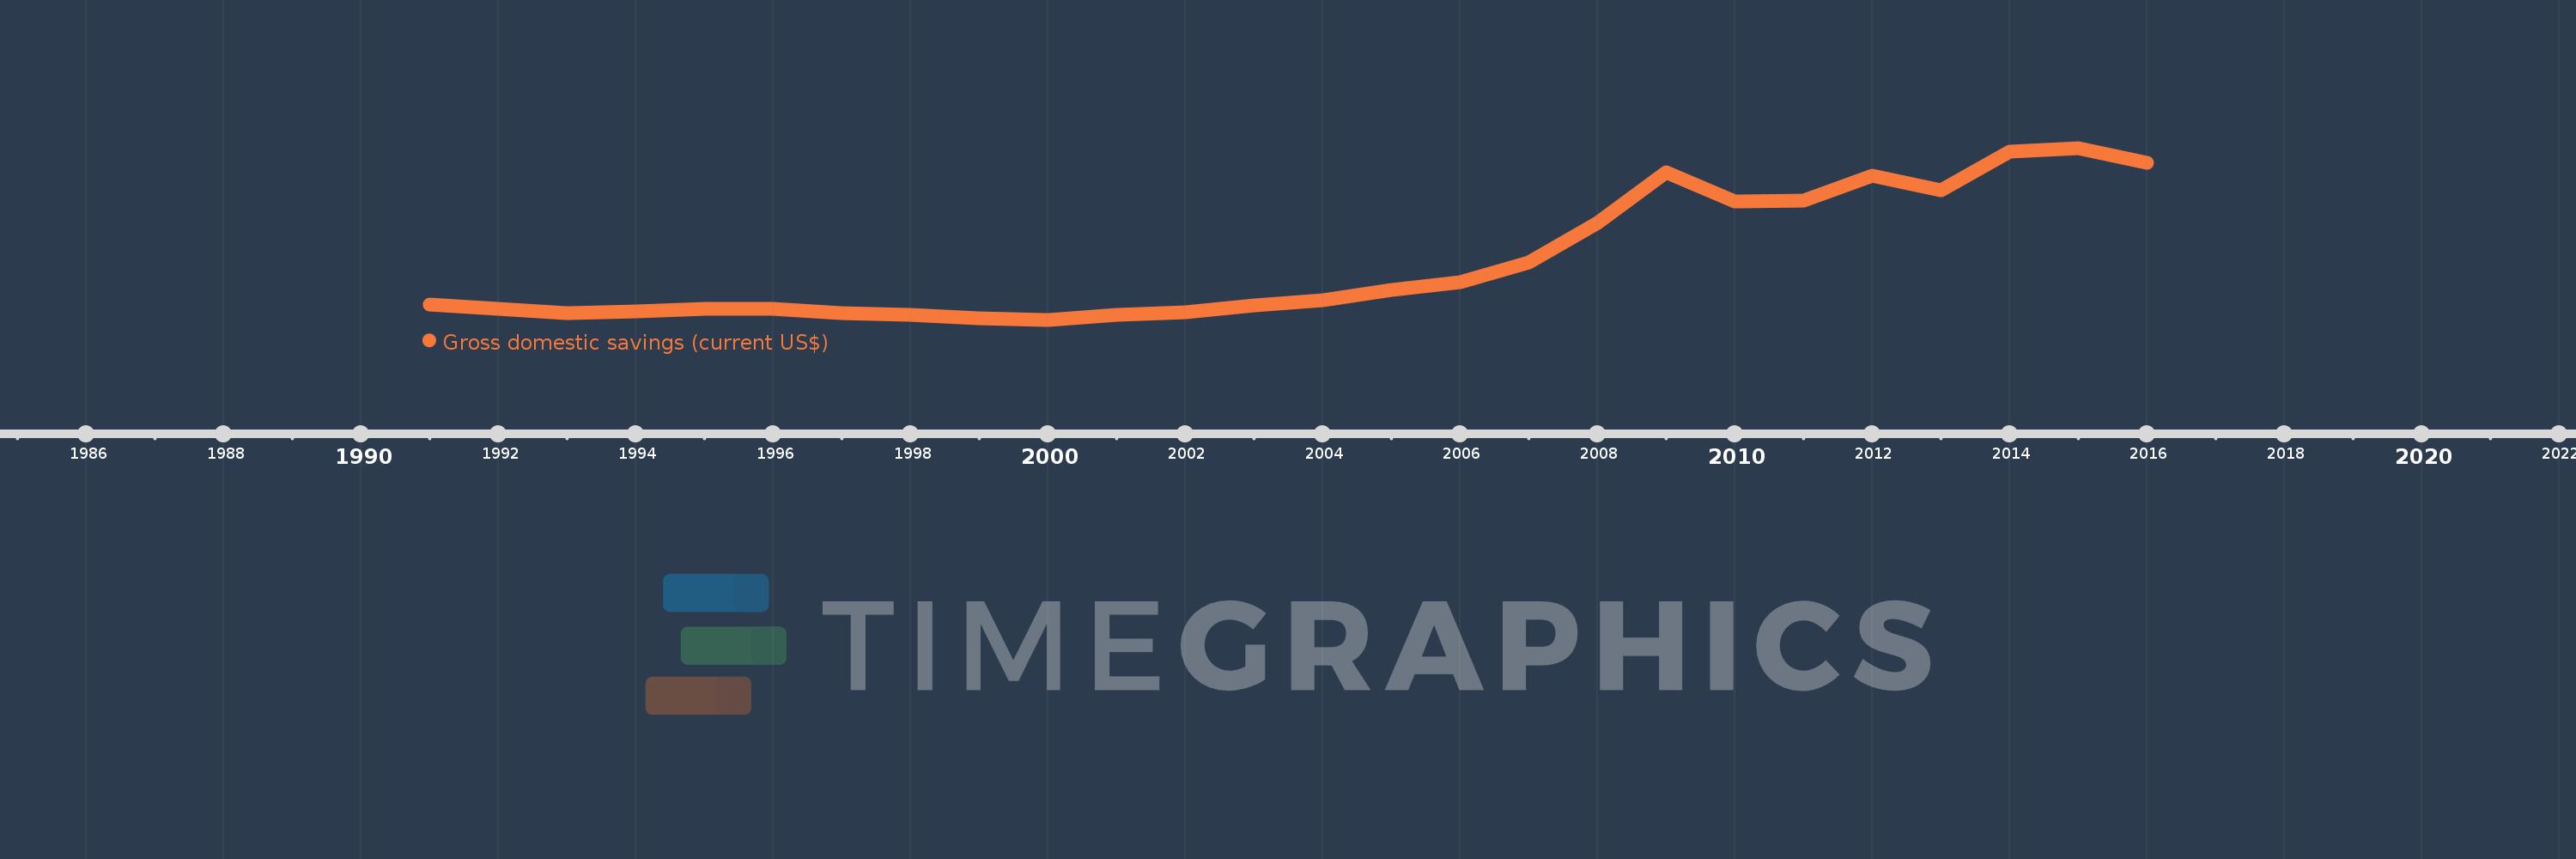
En esta escala de tiempo se presenta un gráfico de 1991 y 2016 de Romania. Los datos de 1990 están ausentes. El número de observaciones reales por fecha: 26.

Fuente (nombre):

Indicadores del desarrollo mundial

Fuente (organización):

World Bank national accounts data, and OECD National Accounts data files.

Categorías:

Economy & Growth

Se ha actualizado:

23 abr 2017 año

Los indicadores de los cambios de valor en los últimos años

En promedio:
18.978 bn
Mínimo:
4.108 bn
1 ene 2000 año
Máximo:
48.379 bn
1 ene 2015 año
A la fecha de observación
Valor
Cambio absoluto
El cambio con respecto al valor anterior
1 ene 1991 año
8.109 bn
+8.109 bn
0.0%
1 ene 1992 año
6.992 bn
-1.117 bn
-13.77%
1 ene 1993 año
5.777 bn
-1.215 bn
-17.37%
1 ene 1994 año
6.316 bn
+538.158 millones
9.31%
1 ene 1995 año
6.84 bn
+524.705 millones
8.31%
1 ene 1996 año
6.997 bn
+156.686 millones
2.29%
1 ene 1997 año
5.783 bn
-1.214 bn
-17.35%
1 ene 1998 año
5.275 bn
-507.752 millones
-8.78%
1 ene 1999 año
4.51 bn
-765.562 millones
-14.51%
1 ene 2000 año
4.108 bn
-401.948 millones
-8.91%
1 ene 2001 año
5.443 bn
+1.335 bn
32.51%
1 ene 2002 año
6.124 bn
+680.433 millones
12.5%
1 ene 2003 año
7.782 bn
+1.659 bn
27.09%
1 ene 2004 año
9.157 bn
+1.374 bn
17.66%
1 ene 2005 año
11.696 bn
+2.54 bn
27.74%
1 ene 2006 año
13.718 bn
+2.021 bn
17.28%
1 ene 2007 año
18.9 bn
+5.183 bn
37.78%
1 ene 2008 año
29.129 bn
+10.229 bn
54.12%
1 ene 2009 año
42.024 bn
+12.894 bn
44.27%
1 ene 2010 año
34.67 bn
-7.354 bn
-17.5%
1 ene 2011 año
34.768 bn
+97.494 millones
0.28%
1 ene 2012 año
41.32 bn
+6.552 bn
18.85%
1 ene 2013 año
37.544 bn
-3.776 bn
-9.14%
1 ene 2014 año
47.479 bn
+9.935 bn
26.46%
1 ene 2015 año
48.379 bn
+900.154 millones
1.9%
1 ene 2016 año
44.591 bn
-3.788 bn
-7.83%

Ranking de los países por los datos estadísticos actuales