33
/es/
AIzaSyAYiBZKx7MnpbEhh9jyipgxe19OcubqV5w
August 1, 2025
273635
Ukraine
UKR
true
2
1
Gross domestic savings (current US$)
2016,2015,2014,2013,2012,2011,2010,2009,2008,2007,2006,2005,2004,2003,2002,2001,2000,1999,1998,1997,1996,1995,1994,1993
Download
Estadísticas Globales de la Biblioteca →Ukraine →

Gross domestic savings (current US$)

Estas estadísticas en otros países:

AfghanistanAlbaniaAlgeriaAngolaAntigua and BarbudaArab WorldArgentinaArmeniaArubaAustraliaAustriaAzerbaijanBahamas, TheBahrainBangladeshBarbadosBelarusBelgiumBelizeBeninBermudaBhutanBoliviaBosnia and HerzegovinaBotswanaBrazilBrunei DarussalamBulgariaBurkina FasoBurundiCabo VerdeCambodiaCameroonCanadaCaribbean small statesCentral African RepublicCentral Europe and the BalticsChadChileChinaColombiaComorosCongo, Dem. Rep.Congo, Rep.Costa RicaCote d'IvoireCroatiaCubaCyprusCzech RepublicDenmarkDjiboutiDominicaDominican RepublicEarly-demographic dividendEast Asia & PacificEast Asia & Pacific (excluding high income)East Asia & Pacific (IDA & IBRD countries)EcuadorEgypt, Arab Rep.El SalvadorEquatorial GuineaEritreaEstoniaEthiopiaEuro areaEurope & Central AsiaEurope & Central Asia (excluding high income)Europe & Central Asia (IDA & IBRD countries)European UnionFaroe IslandsFijiFinlandFragile and conflict affected situationsFranceGabonGambia, TheGeorgiaGermanyGhanaGreeceGrenadaGuatemalaGuineaGuinea-BissauGuyanaHaitiHeavily indebted poor countries (HIPC)High incomeHondurasHong Kong SAR, ChinaHungaryIBRD onlyIcelandIDA & IBRD totalIDA blendIDA onlyIDA totalIndiaIndonesiaIran, Islamic Rep.IraqIrelandIsraelItalyJamaicaJapanJordanKazakhstanKenyaKiribatiKorea, Rep.KosovoKuwaitKyrgyz RepublicLao PDRLate-demographic dividendLatin America & Caribbean Latin America & Caribbean (excluding high income)Latin America & the Caribbean (IDA & IBRD countries)LatviaLeast developed countries: UN classificationLebanonLesothoLiberiaLibyaLithuaniaLow & middle incomeLow incomeLower middle incomeLuxembourgMacao SAR, ChinaMacedonia, FYRMadagascarMalawiMalaysiaMaldivesMaliMaltaMauritaniaMauritiusMexicoMicronesia, Fed. Sts.Middle East & North AfricaMiddle East & North Africa (excluding high income)Middle East & North Africa (IDA & IBRD countries)Middle incomeMoldovaMongoliaMontenegroMoroccoMozambiqueNamibiaNepalNetherlandsNew CaledoniaNew ZealandNicaraguaNigerNigeriaNorth AmericaNorwayOECD membersOmanOther small statesPakistanPanamaPapua New GuineaParaguayPeruPhilippinesPolandPortugalPost-demographic dividendPre-demographic dividendPuerto RicoQatarRomaniaRussian FederationRwandaSaudi ArabiaSenegalSerbiaSeychellesSierra LeoneSingaporeSlovak RepublicSloveniaSmall statesSolomon IslandsSouth AfricaSouth AsiaSouth Asia (IDA & IBRD)South SudanSpainSri LankaSt. Kitts and NevisSt. LuciaSt. Vincent and the GrenadinesSub-Saharan Africa Sub-Saharan Africa (excluding high income)Sub-Saharan Africa (IDA & IBRD countries)SudanSurinameSwazilandSwedenSwitzerlandSyrian Arab RepublicTajikistanTanzaniaThailandTimor-LesteTogoTongaTrinidad and TobagoTunisiaTurkeyTurkmenistanUgandaUkraineUnited Arab EmiratesUnited KingdomUnited StatesUpper middle incomeUruguayUzbekistanVanuatuVenezuela, RBVietnamWest Bank and GazaWorldYemen, Rep.ZambiaZimbabwe

línea de tiempo (timeline):

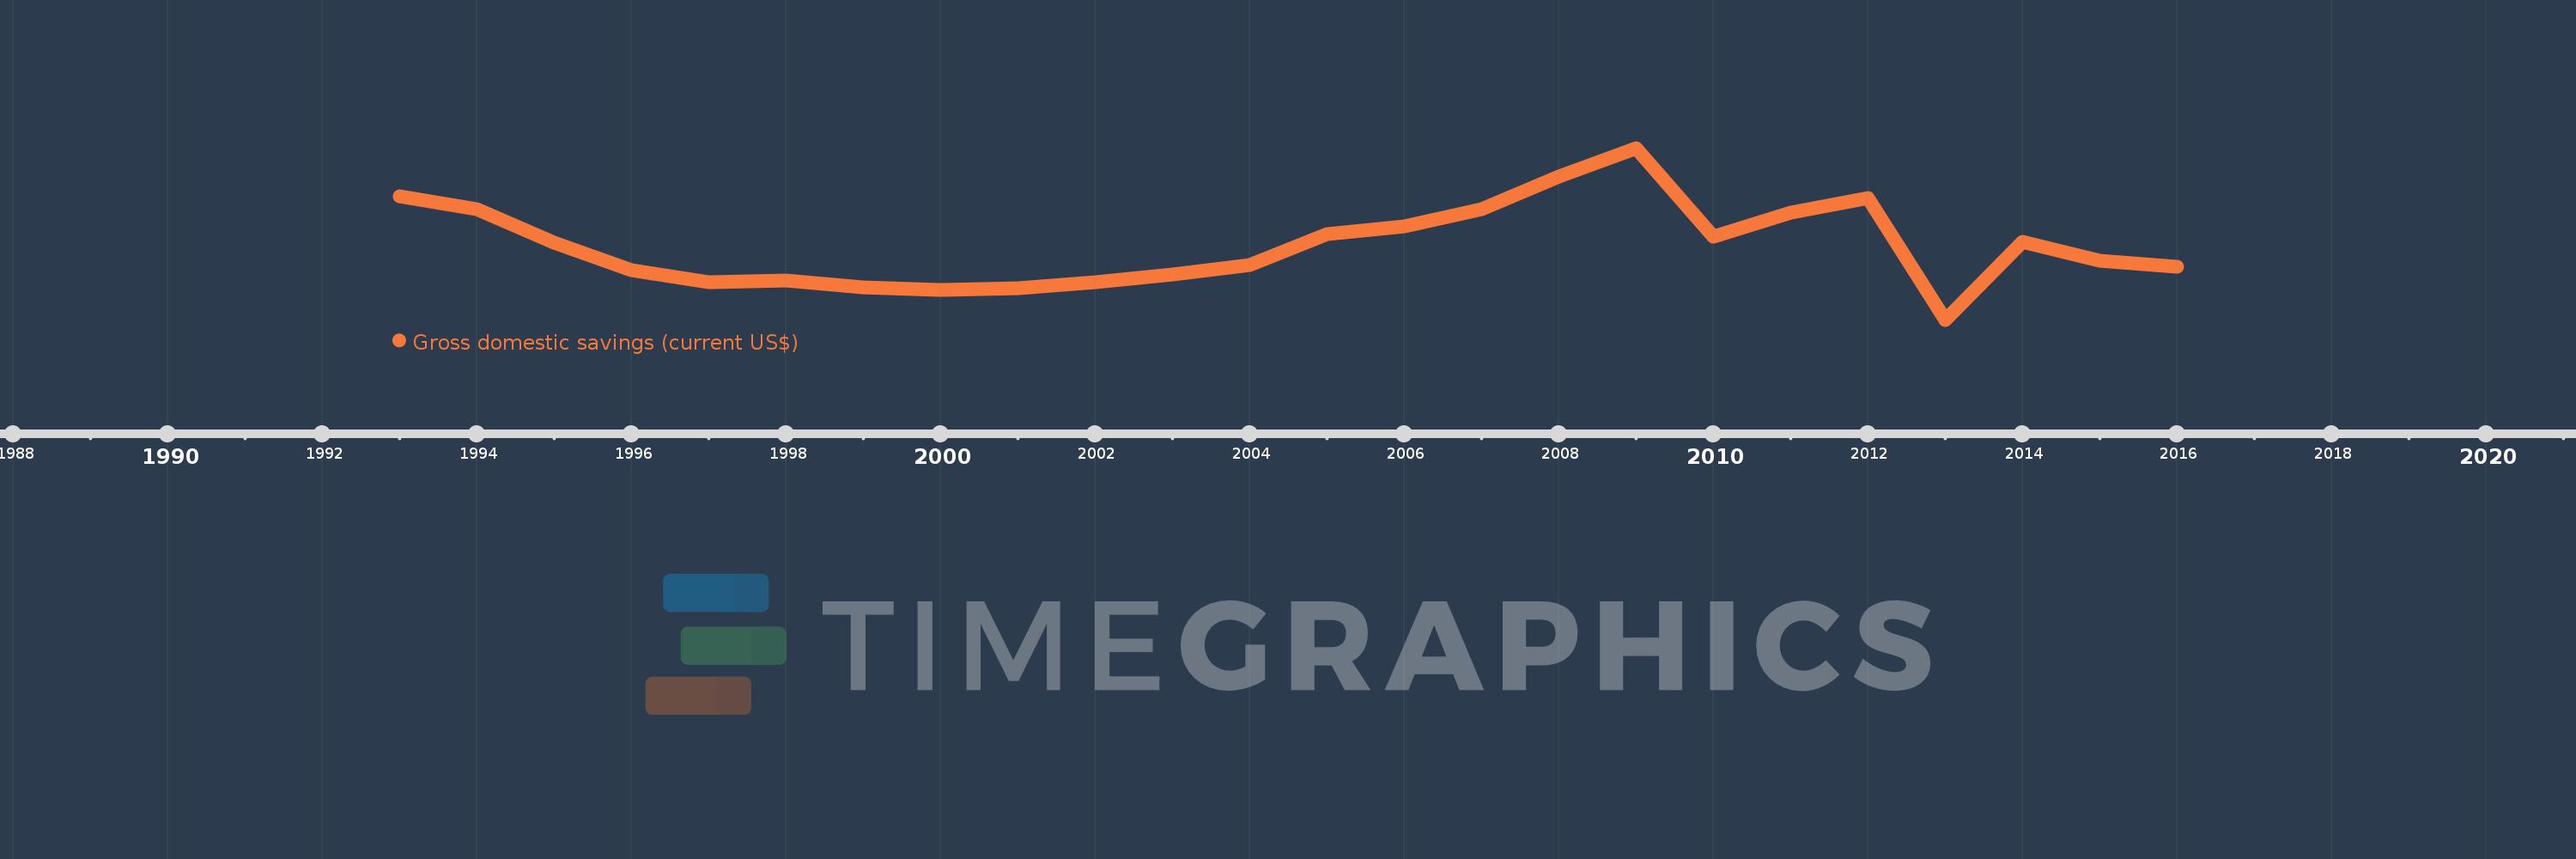
En esta escala de tiempo se presenta un gráfico de 1993 y 2016 de Ukraine. Los datos de 1992 están ausentes. El número de observaciones reales por fecha: 24.

Fuente (nombre):

Indicadores del desarrollo mundial

Fuente (organización):

World Bank national accounts data, and OECD National Accounts data files.

Categorías:

Economy & Growth

Se ha actualizado:

23 abr 2017 año

Los indicadores de los cambios de valor en los últimos años

En promedio:
16.224 bn
Mínimo:
1.334 bn
1 ene 2013 año
Máximo:
35.912 bn
1 ene 2009 año
A la fecha de observación
Valor
Cambio absoluto
El cambio con respecto al valor anterior
1 ene 1993 año
26.201 bn
+26.201 bn
0.0%
1 ene 1994 año
23.605 bn
-2.596 bn
-9.91%
1 ene 1995 año
16.901 bn
-6.705 bn
-28.4%
1 ene 1996 año
11.379 bn
-5.522 bn
-32.67%
1 ene 1997 año
8.964 bn
-2.414 bn
-21.22%
1 ene 1998 año
9.221 bn
+256.944 millones
2.87%
1 ene 1999 año
7.766 bn
-1.455 bn
-15.78%
1 ene 2000 año
7.254 bn
-512.706 millones
-6.6%
1 ene 2001 año
7.71 bn
+455.866 millones
6.28%
1 ene 2002 año
8.891 bn
+1.181 bn
15.32%
1 ene 2003 año
10.399 bn
+1.508 bn
16.96%
1 ene 2004 año
12.302 bn
+1.904 bn
18.31%
1 ene 2005 año
18.588 bn
+6.285 bn
51.09%
1 ene 2006 año
20.176 bn
+1.589 bn
8.55%
1 ene 2007 año
23.613 bn
+3.437 bn
17.03%
1 ene 2008 año
30.164 bn
+6.55 bn
27.74%
1 ene 2009 año
35.912 bn
+5.748 bn
19.06%
1 ene 2010 año
18.036 bn
-17.876 bn
-49.78%
1 ene 2011 año
22.905 bn
+4.869 bn
27.0%
1 ene 2012 año
25.825 bn
+2.92 bn
12.75%
1 ene 2013 año
1.334 bn
-24.491 bn
-94.84%
1 ene 2014 año
16.961 bn
+15.627 bn
1.17 mil%
1 ene 2015 año
13.204 bn
-3.756 bn
-22.15%
1 ene 2016 año
12.077 bn
-1.127 bn
-8.54%

Ranking de los países por los datos estadísticos actuales