33
/es/
AIzaSyAYiBZKx7MnpbEhh9jyipgxe19OcubqV5w
August 1, 2025
66078
Algeria
DZA
true
2
1
Gross savings (current LCU)
2015,2014,2013,2012,2011,2010,2009,2008,2007,2006,1992,1991,1990,1989,1988,1987,1986,1985,1984,1983,1982,1981,1980,1979,1978
Download
Estadísticas Globales de la Biblioteca →Algeria →

Gross savings (current LCU)

Estas estadísticas en otros países:

AfghanistanAlbaniaAlgeriaAngolaAntigua and BarbudaArgentinaArmeniaAustraliaAustriaAzerbaijanBahamas, TheBahrainBangladeshBarbadosBelarusBelgiumBelizeBeninBermudaBhutanBoliviaBosnia and HerzegovinaBotswanaBrazilBrunei DarussalamBulgariaBurkina FasoBurundiCabo VerdeCambodiaCameroonCanadaCentral African RepublicChadChileChinaColombiaComorosCongo, Dem. Rep.Congo, Rep.Costa RicaCote d'IvoireCroatiaCyprusCzech RepublicDenmarkDjiboutiDominicaDominican RepublicEcuadorEgypt, Arab Rep.El SalvadorEquatorial GuineaEritreaEstoniaEthiopiaFaroe IslandsFijiFinlandFranceGabonGambia, TheGeorgiaGermanyGhanaGreeceGrenadaGuatemalaGuineaGuinea-BissauGuyanaHaitiHondurasHong Kong SAR, ChinaHungaryIcelandIndiaIndonesiaIran, Islamic Rep.IraqIrelandIsraelItalyJamaicaJapanJordanKazakhstanKenyaKiribatiKorea, Rep.KosovoKuwaitKyrgyz RepublicLao PDRLatviaLebanonLesothoLiberiaLibyaLithuaniaLuxembourgMacao SAR, ChinaMacedonia, FYRMadagascarMalawiMalaysiaMaldivesMaliMaltaMauritaniaMauritiusMexicoMoldovaMongoliaMontenegroMoroccoMozambiqueNamibiaNepalNetherlandsNew ZealandNicaraguaNigerNigeriaNorwayOmanPakistanPanamaPapua New GuineaParaguayPeruPhilippinesPolandPortugalQatarRomaniaRussian FederationRwandaSaudi ArabiaSenegalSerbiaSeychellesSierra LeoneSingaporeSlovak RepublicSloveniaSolomon IslandsSouth AfricaSouth SudanSpainSri LankaSt. Kitts and NevisSt. LuciaSt. Vincent and the GrenadinesSudanSurinameSwazilandSwedenSwitzerlandSyrian Arab RepublicTajikistanTanzaniaThailandTimor-LesteTogoTongaTrinidad and TobagoTunisiaTurkeyUgandaUkraineUnited KingdomUnited StatesUruguayVanuatuVenezuela, RBVietnamWest Bank and GazaYemen, Rep.ZambiaZimbabwe

línea de tiempo (timeline):

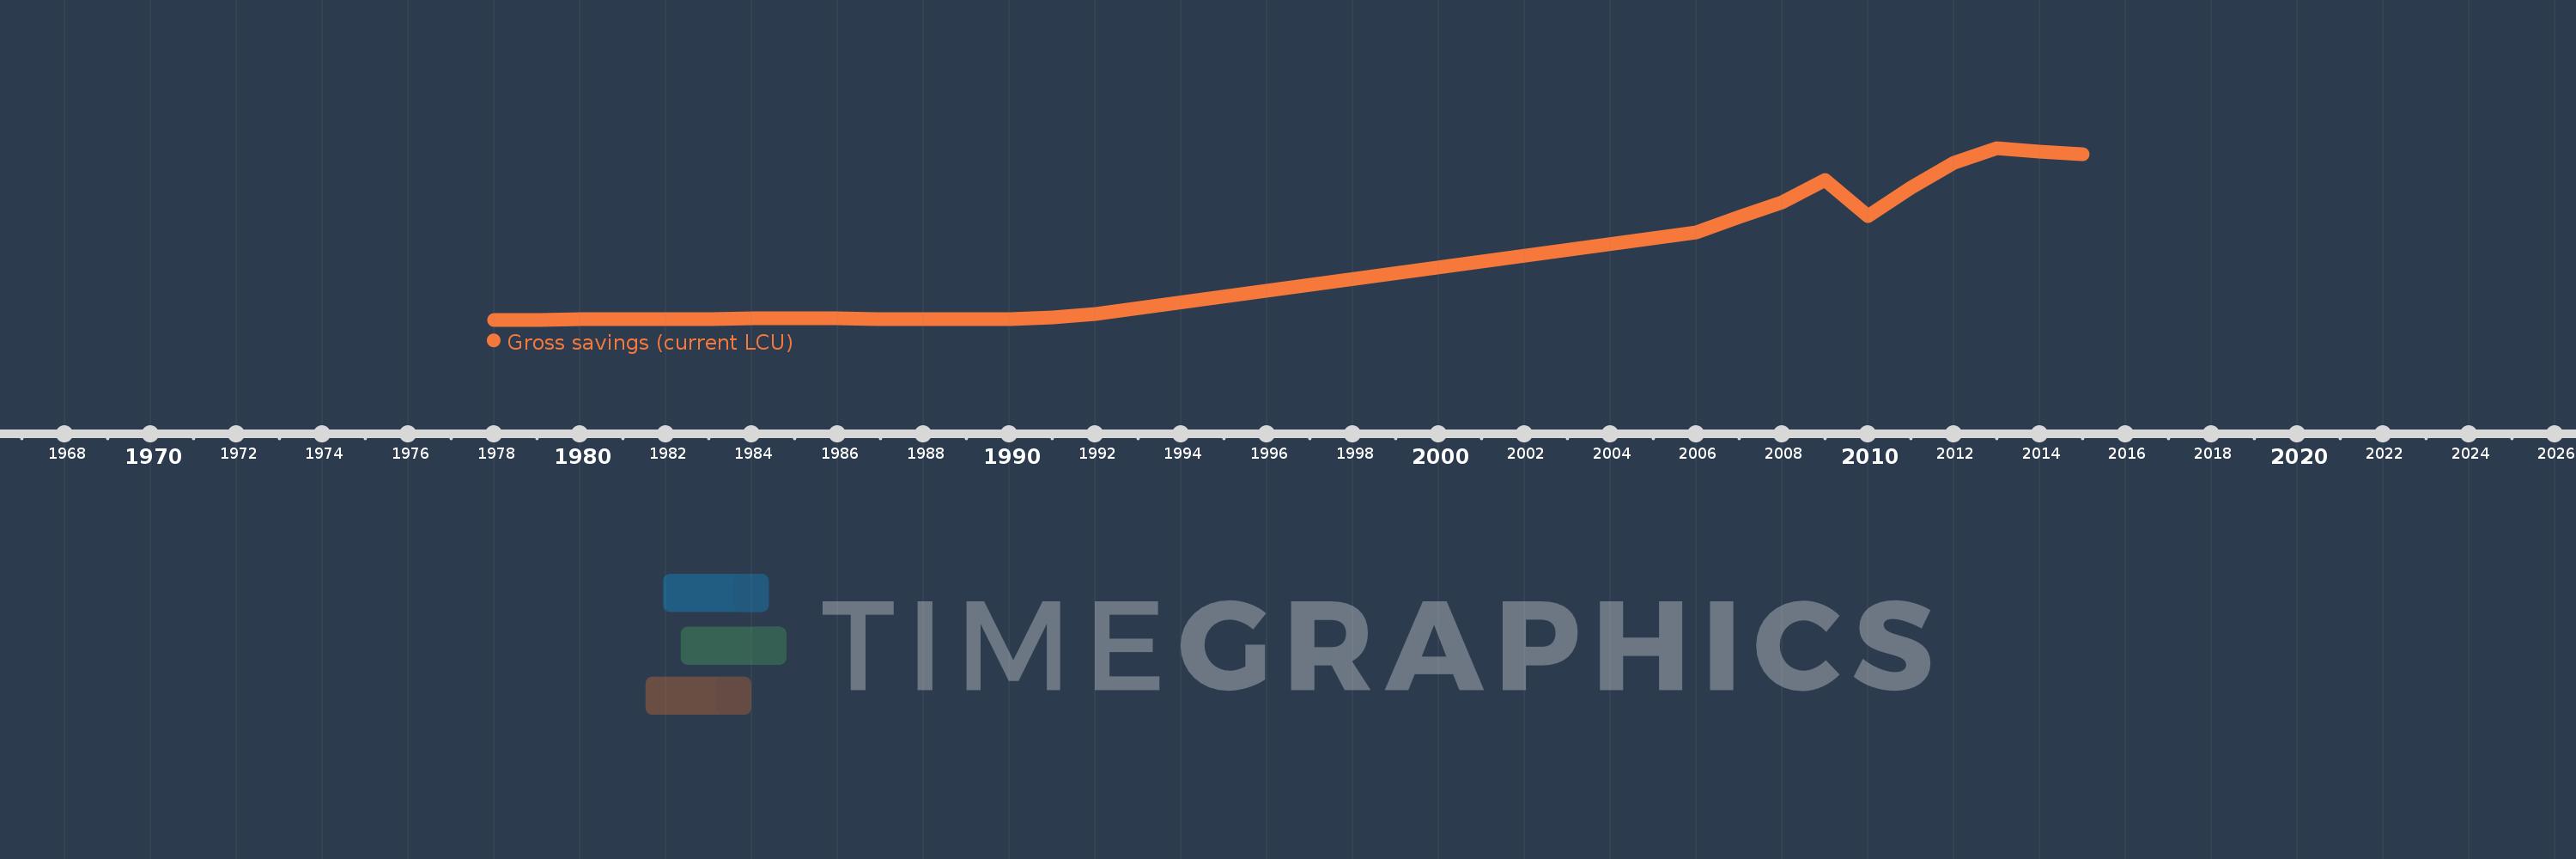
En esta escala de tiempo se presenta un gráfico de 1978 y 2015 de Algeria. Los datos de 1977 están ausentes. El número de observaciones reales por fecha: 25.

Fuente (nombre):

Indicadores del desarrollo mundial

Fuente (organización):

World Bank national accounts data, and OECD National Accounts data files.

Categorías:

Economy & Growth

Se ha actualizado:

23 abr 2017 año

Los indicadores de los cambios de valor en los últimos años

En promedio:
2.488 billones
Mínimo:
30.767 bn
1 ene 1978 año
Máximo:
7.77 billones
1 ene 2013 año
A la fecha de observación
Valor
Cambio absoluto
El cambio con respecto al valor anterior
1 ene 1978 año
30.767 bn
+30.767 bn
0.0%
1 ene 1979 año
38.25 bn
+7.483 bn
24.32%
1 ene 1980 año
49.337 bn
+11.087 bn
28.99%
1 ene 1981 año
66.558 bn
+17.221 bn
34.91%
1 ene 1982 año
73.828 bn
+7.27 bn
10.92%
1 ene 1983 año
76.883 bn
+3.055 bn
4.14%
1 ene 1984 año
88.074 bn
+11.191 bn
14.56%
1 ene 1985 año
82.938 bn
-5.137 bn
-5.83%
1 ene 1986 año
85.507 bn
+2.569 bn
3.1%
1 ene 1987 año
66.468 bn
-19.039 bn
-22.27%
1 ene 1988 año
70.889 bn
+4.421 bn
6.65%
1 ene 1989 año
62.222 bn
-8.667 bn
-12.23%
1 ene 1990 año
75.233 bn
+13.011 bn
20.91%
1 ene 1991 año
134.861 bn
+59.628 bn
79.26%
1 ene 1992 año
278.482 bn
+143.621 bn
106.5%
1 ene 2006 año
3.958 billones
+3.68 billones
1.32 mil%
1 ene 2007 año
4.647 billones
+688.539 bn
17.39%
1 ene 2008 año
5.329 billones
+682.403 bn
14.68%
1 ene 2009 año
6.343 billones
+1.014 billones
19.02%
1 ene 2010 año
4.719 billones
-1.624 billones
-25.6%
1 ene 2011 año
5.993 billones
+1.273 billones
26.98%
1 ene 2012 año
7.091 billones
+1.098 billones
18.32%
1 ene 2013 año
7.77 billones
+678.933 bn
9.57%
1 ene 2014 año
7.599 billones
-170.584 bn
-2.2%
1 ene 2015 año
7.479 billones
-120.542 bn
-1.59%

Ranking de los países por los datos estadísticos actuales