30
/es/
AIzaSyAYiBZKx7MnpbEhh9jyipgxe19OcubqV5w
April 1, 2024
108588
Comoros
COM
true
2
1
Gross savings (current LCU)
2013,2012,2011,2010,2009,2008,2007,2006,2005,2004,1996,1995,1994,1993,1992,1991,1990,1989,1988,1987,1986,1985,1984,1983,1982,1981
Download
Estadísticas Globales de la Biblioteca →Comoros →

Gross savings (current LCU)

Estas estadísticas en otros países:

AfghanistanAlbaniaAlgeriaAngolaAntigua and BarbudaArgentinaArmeniaAustraliaAustriaAzerbaijanBahamas, TheBahrainBangladeshBarbadosBelarusBelgiumBelizeBeninBermudaBhutanBoliviaBosnia and HerzegovinaBotswanaBrazilBrunei DarussalamBulgariaBurkina FasoBurundiCabo VerdeCambodiaCameroonCanadaCentral African RepublicChadChileChinaColombiaComorosCongo, Dem. Rep.Congo, Rep.Costa RicaCote d'IvoireCroatiaCyprusCzech RepublicDenmarkDjiboutiDominicaDominican RepublicEcuadorEgypt, Arab Rep.El SalvadorEquatorial GuineaEritreaEstoniaEthiopiaFaroe IslandsFijiFinlandFranceGabonGambia, TheGeorgiaGermanyGhanaGreeceGrenadaGuatemalaGuineaGuinea-BissauGuyanaHaitiHondurasHong Kong SAR, ChinaHungaryIcelandIndiaIndonesiaIran, Islamic Rep.IraqIrelandIsraelItalyJamaicaJapanJordanKazakhstanKenyaKiribatiKorea, Rep.KosovoKuwaitKyrgyz RepublicLao PDRLatviaLebanonLesothoLiberiaLibyaLithuaniaLuxembourgMacao SAR, ChinaMacedonia, FYRMadagascarMalawiMalaysiaMaldivesMaliMaltaMauritaniaMauritiusMexicoMoldovaMongoliaMontenegroMoroccoMozambiqueNamibiaNepalNetherlandsNew ZealandNicaraguaNigerNigeriaNorwayOmanPakistanPanamaPapua New GuineaParaguayPeruPhilippinesPolandPortugalQatarRomaniaRussian FederationRwandaSaudi ArabiaSenegalSerbiaSeychellesSierra LeoneSingaporeSlovak RepublicSloveniaSolomon IslandsSouth AfricaSouth SudanSpainSri LankaSt. Kitts and NevisSt. LuciaSt. Vincent and the GrenadinesSudanSurinameSwazilandSwedenSwitzerlandSyrian Arab RepublicTajikistanTanzaniaThailandTimor-LesteTogoTongaTrinidad and TobagoTunisiaTurkeyUgandaUkraineUnited KingdomUnited StatesUruguayVanuatuVenezuela, RBVietnamWest Bank and GazaYemen, Rep.ZambiaZimbabwe

línea de tiempo (timeline):

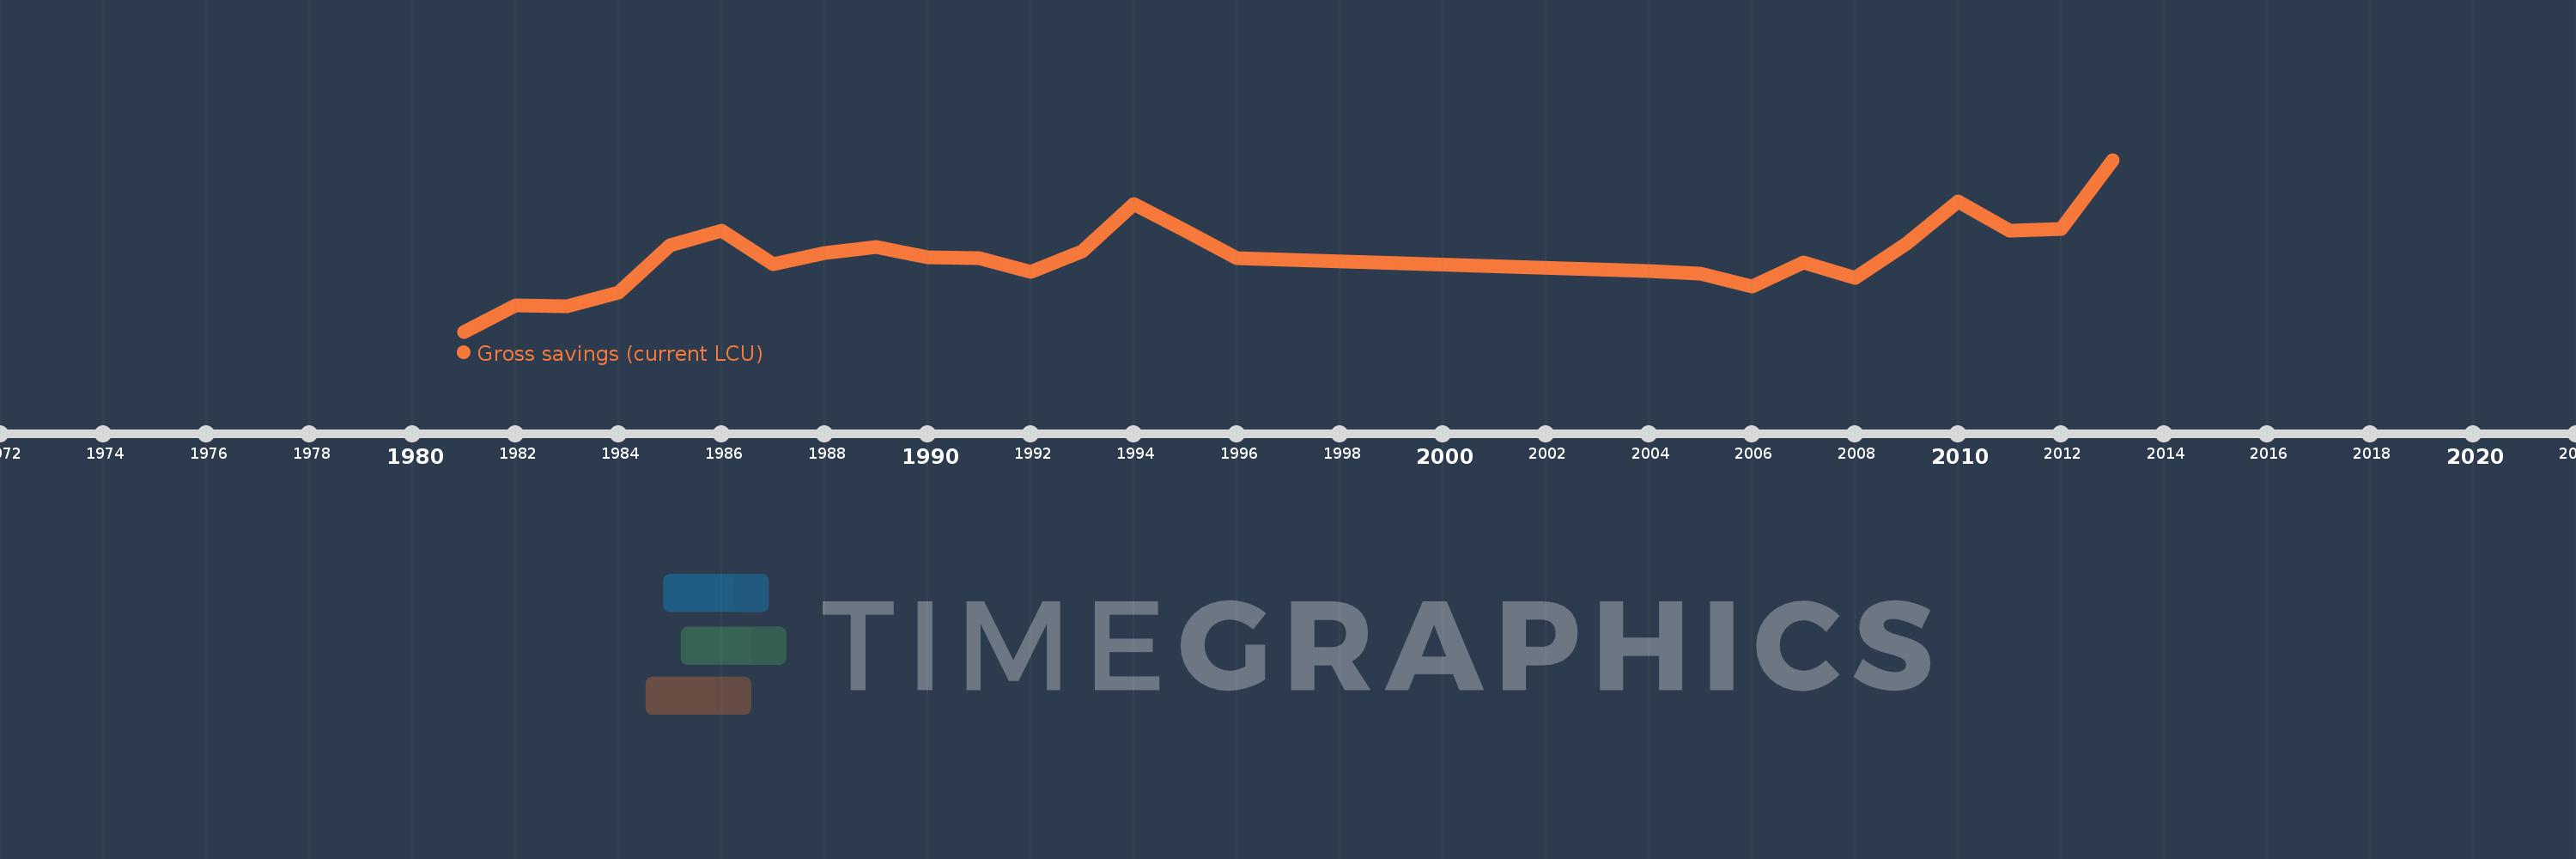
En esta escala de tiempo se presenta un gráfico de 1981 y 2013 de Comoros. Los datos de 1980 están ausentes. El número de observaciones reales por fecha: 26.

Fuente (nombre):

Indicadores del desarrollo mundial

Fuente (organización):

World Bank national accounts data, and OECD National Accounts data files.

Categorías:

Economy & Growth

Se ha actualizado:

23 abr 2017 año

Los indicadores de los cambios de valor en los últimos años

En promedio:
10.105 bn
Mínimo:
-94.408 millones
1 ene 1981 año
Máximo:
22.937 bn
1 ene 2013 año
A la fecha de observación
Valor
Cambio absoluto
El cambio con respecto al valor anterior
1 ene 1981 año
-94.408 millones
-94.408 millones
0.0%
1 ene 1982 año
3.416 bn
+3.51 bn
-3.72 mil%
1 ene 1983 año
3.346 bn
-69.628 millones
-2.04%
1 ene 1984 año
5.122 bn
+1.776 bn
53.08%
1 ene 1985 año
11.431 bn
+6.308 bn
123.15%
1 ene 1986 año
13.416 bn
+1.986 bn
17.37%
1 ene 1987 año
8.91 bn
-4.506 bn
-33.58%
1 ene 1988 año
10.442 bn
+1.532 bn
17.19%
1 ene 1989 año
11.21 bn
+767.211 millones
7.35%
1 ene 1990 año
9.905 bn
-1.304 bn
-11.64%
1 ene 1991 año
9.791 bn
-114.161 millones
-1.15%
1 ene 1992 año
7.956 bn
-1.835 bn
-18.74%
1 ene 1993 año
10.64 bn
+2.684 bn
33.74%
1 ene 1994 año
17.061 bn
+6.421 bn
60.35%
1 ene 1995 año
13.39 bn
-3.671 bn
-21.52%
1 ene 1996 año
9.798 bn
-3.592 bn
-26.83%
1 ene 2004 año
8.077 bn
-1.721 bn
-17.56%
1 ene 2005 año
7.637 bn
-440.604 millones
-5.45%
1 ene 2006 año
5.982 bn
-1.655 bn
-21.67%
1 ene 2007 año
9.211 bn
+3.23 bn
53.99%
1 ene 2008 año
7.046 bn
-2.165 bn
-23.5%
1 ene 2009 año
11.652 bn
+4.606 bn
65.37%
1 ene 2010 año
17.307 bn
+5.654 bn
48.53%
1 ene 2011 año
13.414 bn
-3.893 bn
-22.49%
1 ene 2012 año
13.723 bn
+308.935 millones
2.3%
1 ene 2013 año
22.937 bn
+9.214 bn
67.14%

Ranking de los países por los datos estadísticos actuales