29
/es/
es
AIzaSyAYiBZKx7MnpbEhh9jyipgxe19OcubqV5w
April 1, 2024
273661
Ukraine
UKR
true
2
1
Gross savings (current LCU)
2016,2015,2014,2013,2012,2011,2010,2009,2008,2007,2006,2005,2004,2003,2002,2001,2000,1999,1998,1997,1996,1995
Download
Estadísticas Globales de la Biblioteca →Ukraine →

Gross savings (current LCU)

Estas estadísticas en otros países:
AfghanistanAlbaniaAlgeriaAngolaAntigua and BarbudaArgentinaArmeniaAustraliaAustriaAzerbaijanBahamas, TheBahrainBangladeshBarbadosBelarusBelgiumBelizeBeninBermudaBhutanBoliviaBosnia and HerzegovinaBotswanaBrazilBrunei DarussalamBulgariaBurkina FasoBurundiCabo VerdeCambodiaCameroonCanadaCentral African RepublicChadChileChinaColombiaComorosCongo, Dem. Rep.Congo, Rep.Costa RicaCote d'IvoireCroatiaCyprusCzech RepublicDenmarkDjiboutiDominicaDominican RepublicEcuadorEgypt, Arab Rep.El SalvadorEquatorial GuineaEritreaEstoniaEthiopiaFaroe IslandsFijiFinlandFranceGabonGambia, TheGeorgiaGermanyGhanaGreeceGrenadaGuatemalaGuineaGuinea-BissauGuyanaHaitiHondurasHong Kong SAR, ChinaHungaryIcelandIndiaIndonesiaIran, Islamic Rep.IraqIrelandIsraelItalyJamaicaJapanJordanKazakhstanKenyaKiribatiKorea, Rep.KosovoKuwaitKyrgyz RepublicLao PDRLatviaLebanonLesothoLiberiaLibyaLithuaniaLuxembourgMacao SAR, ChinaMacedonia, FYRMadagascarMalawiMalaysiaMaldivesMaliMaltaMauritaniaMauritiusMexicoMoldovaMongoliaMontenegroMoroccoMozambiqueNamibiaNepalNetherlandsNew ZealandNicaraguaNigerNigeriaNorwayOmanPakistanPanamaPapua New GuineaParaguayPeruPhilippinesPolandPortugalQatarRomaniaRussian FederationRwandaSaudi ArabiaSenegalSerbiaSeychellesSierra LeoneSingaporeSlovak RepublicSloveniaSolomon IslandsSouth AfricaSouth SudanSpainSri LankaSt. Kitts and NevisSt. LuciaSt. Vincent and the GrenadinesSudanSurinameSwazilandSwedenSwitzerlandSyrian Arab RepublicTajikistanTanzaniaThailandTimor-LesteTogoTongaTrinidad and TobagoTunisiaTurkeyUgandaUkraineUnited KingdomUnited StatesUruguayVanuatuVenezuela, RBVietnamWest Bank and GazaYemen, Rep.ZambiaZimbabwe
línea de tiempo (timeline):
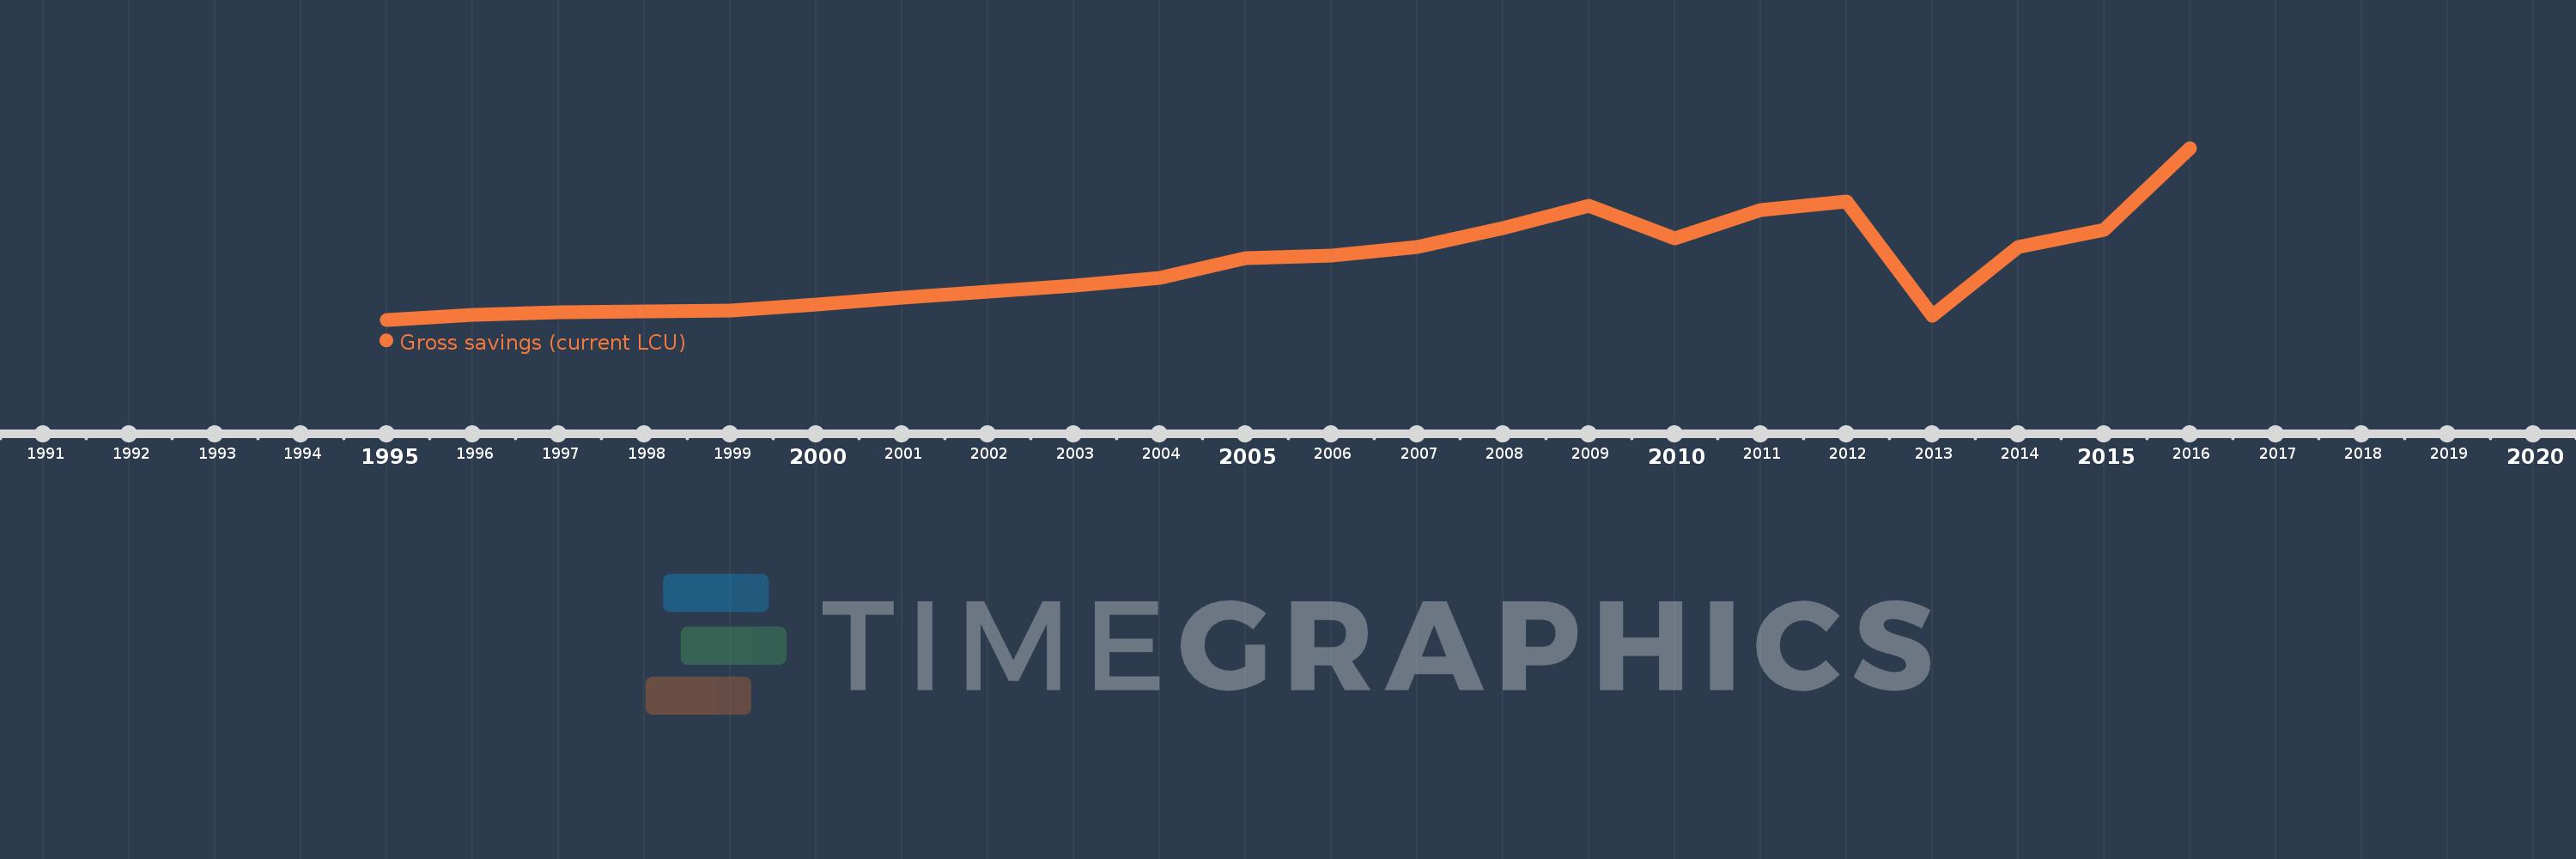
En esta escala de tiempo se presenta un gráfico de 1995 y 2016 de Ukraine. Los datos de 1994 están ausentes. El número de observaciones reales por fecha: 22.
Fuente (nombre):
Indicadores del desarrollo mundial
Fuente (organización):
World Bank national accounts data, and OECD National Accounts data files.
Categorías:
Economy & Growth
Se ha actualizado:
23 abr 2017 año
Los indicadores de los cambios de valor en los últimos años
En promedio:
98.209 bn
Mínimo:
3.919 bn
1 ene 1995 año
Máximo:
295.186 bn
1 ene 2016 año
A la fecha de observación
Valor
Cambio absoluto
El cambio con respecto al valor anterior
1 ene 1995 año
3.919 bn
+3.919 bn
0.0%
1 ene 1996 año
12.522 bn
+8.603 bn
219.52%
1 ene 1997 año
16.284 bn
+3.762 bn
30.04%
1 ene 1998 año
17.541 bn
+1.257 bn
7.72%
1 ene 1999 año
18.871 bn
+1.329 bn
7.58%
1 ene 2000 año
29.288 bn
+10.417 bn
55.2%
1 ene 2001 año
41.431 bn
+12.143 bn
41.46%
1 ene 2002 año
52.0 bn
+10.569 bn
25.51%
1 ene 2003 año
62.393 bn
+10.394 bn
19.99%
1 ene 2004 año
74.153 bn
+11.76 bn
18.85%
1 ene 2005 año
108.32 bn
+34.167 bn
46.08%
1 ene 2006 año
112.93 bn
+4.61 bn
4.26%
1 ene 2007 año
126.575 bn
+13.645 bn
12.08%
1 ene 2008 año
159.508 bn
+32.934 bn
26.02%
1 ene 2009 año
197.513 bn
+38.005 bn
23.83%
1 ene 2010 año
142.241 bn
-55.272 bn
-27.98%
1 ene 2011 año
189.429 bn
+47.188 bn
33.17%
1 ene 2012 año
205.059 bn
+15.63 bn
8.25%
1 ene 2013 año
10.718 bn
-194.341 bn
-94.77%
1 ene 2014 año
127.979 bn
+117.261 bn
1.09 mil%
1 ene 2015 año
156.748 bn
+28.769 bn
22.48%
1 ene 2016 año
295.186 bn
+138.437 bn
88.32%
Ranking de los países por los datos estadísticos actuales

Comentarios:

Enviar
PremiumAbout & FeedbackAcuerdoPrivacidad
logo
© 2022 Selected Technologies LLC – Morgan Hill, California