30
/es/
AIzaSyAYiBZKx7MnpbEhh9jyipgxe19OcubqV5w
April 1, 2024
46099
Low income
LIC
false
2
1
GDP (current US$)
2016,2015,2014,2013,2012,2011,2010,2009,2008,2007,2006,2005,2004,2003,2002,2001,2000,1999,1998,1997,1996,1995,1994,1993,1992,1991,1990,1989
Download
Estadísticas Globales de la Biblioteca →Low income →

GDP (current US$)

Estas estadísticas en otros países:

AfghanistanAlbaniaAlgeriaAndorraAngolaAntigua and BarbudaArab WorldArgentinaArmeniaArubaAustraliaAustriaAzerbaijanBahamas, TheBahrainBangladeshBarbadosBelarusBelgiumBelizeBeninBermudaBhutanBoliviaBosnia and HerzegovinaBotswanaBrazilBrunei DarussalamBulgariaBurkina FasoBurundiCabo VerdeCambodiaCameroonCanadaCaribbean small statesCayman IslandsCentral African RepublicCentral Europe and the BalticsChadChannel IslandsChileChinaColombiaComorosCongo, Dem. Rep.Congo, Rep.Costa RicaCote d'IvoireCroatiaCubaCyprusCzech RepublicDenmarkDjiboutiDominicaDominican RepublicEarly-demographic dividendEast Asia & PacificEast Asia & Pacific (excluding high income)East Asia & Pacific (IDA & IBRD countries)EcuadorEgypt, Arab Rep.El SalvadorEquatorial GuineaEritreaEstoniaEthiopiaEuro areaEurope & Central AsiaEurope & Central Asia (excluding high income)Europe & Central Asia (IDA & IBRD countries)European UnionFaroe IslandsFijiFinlandFragile and conflict affected situationsFranceFrench PolynesiaGabonGambia, TheGeorgiaGermanyGhanaGreeceGreenlandGrenadaGuatemalaGuineaGuinea-BissauGuyanaHaitiHeavily indebted poor countries (HIPC)High incomeHondurasHong Kong SAR, ChinaHungaryIBRD onlyIcelandIDA & IBRD totalIDA blendIDA onlyIDA totalIndiaIndonesiaIran, Islamic Rep.IraqIrelandIsle of ManIsraelItalyJamaicaJapanJordanKazakhstanKenyaKiribatiKorea, Rep.KosovoKuwaitKyrgyz RepublicLao PDRLate-demographic dividendLatin America & Caribbean Latin America & Caribbean (excluding high income)Latin America & the Caribbean (IDA & IBRD countries)LatviaLeast developed countries: UN classificationLebanonLesothoLiberiaLibyaLiechtensteinLithuaniaLow & middle incomeLow incomeLower middle incomeLuxembourgMacao SAR, ChinaMacedonia, FYRMadagascarMalawiMalaysiaMaldivesMaliMaltaMarshall IslandsMauritaniaMauritiusMexicoMicronesia, Fed. Sts.Middle East & North AfricaMiddle East & North Africa (excluding high income)Middle East & North Africa (IDA & IBRD countries)Middle incomeMoldovaMonacoMongoliaMontenegroMoroccoMozambiqueMyanmarNamibiaNauruNepalNetherlandsNew CaledoniaNew ZealandNicaraguaNigerNigeriaNorth AmericaNorwayOECD membersOmanOther small statesPacific island small statesPakistanPalauPanamaPapua New GuineaParaguayPeruPhilippinesPolandPortugalPost-demographic dividendPre-demographic dividendPuerto RicoQatarRomaniaRussian FederationRwandaSamoaSan MarinoSao Tome and PrincipeSaudi ArabiaSenegalSerbiaSeychellesSierra LeoneSingaporeSlovak RepublicSloveniaSmall statesSolomon IslandsSomaliaSouth AfricaSouth AsiaSouth Asia (IDA & IBRD)South SudanSpainSri LankaSt. Kitts and NevisSt. LuciaSt. Vincent and the GrenadinesSub-Saharan Africa Sub-Saharan Africa (excluding high income)Sub-Saharan Africa (IDA & IBRD countries)SudanSurinameSwazilandSwedenSwitzerlandSyrian Arab RepublicTajikistanTanzaniaThailandTimor-LesteTogoTongaTrinidad and TobagoTunisiaTurkeyTurkmenistanTuvaluUgandaUkraineUnited Arab EmiratesUnited KingdomUnited StatesUpper middle incomeUruguayUzbekistanVanuatuVenezuela, RBVietnamVirgin Islands (U.S.)West Bank and GazaWorldYemen, Rep.ZambiaZimbabwe

línea de tiempo (timeline):

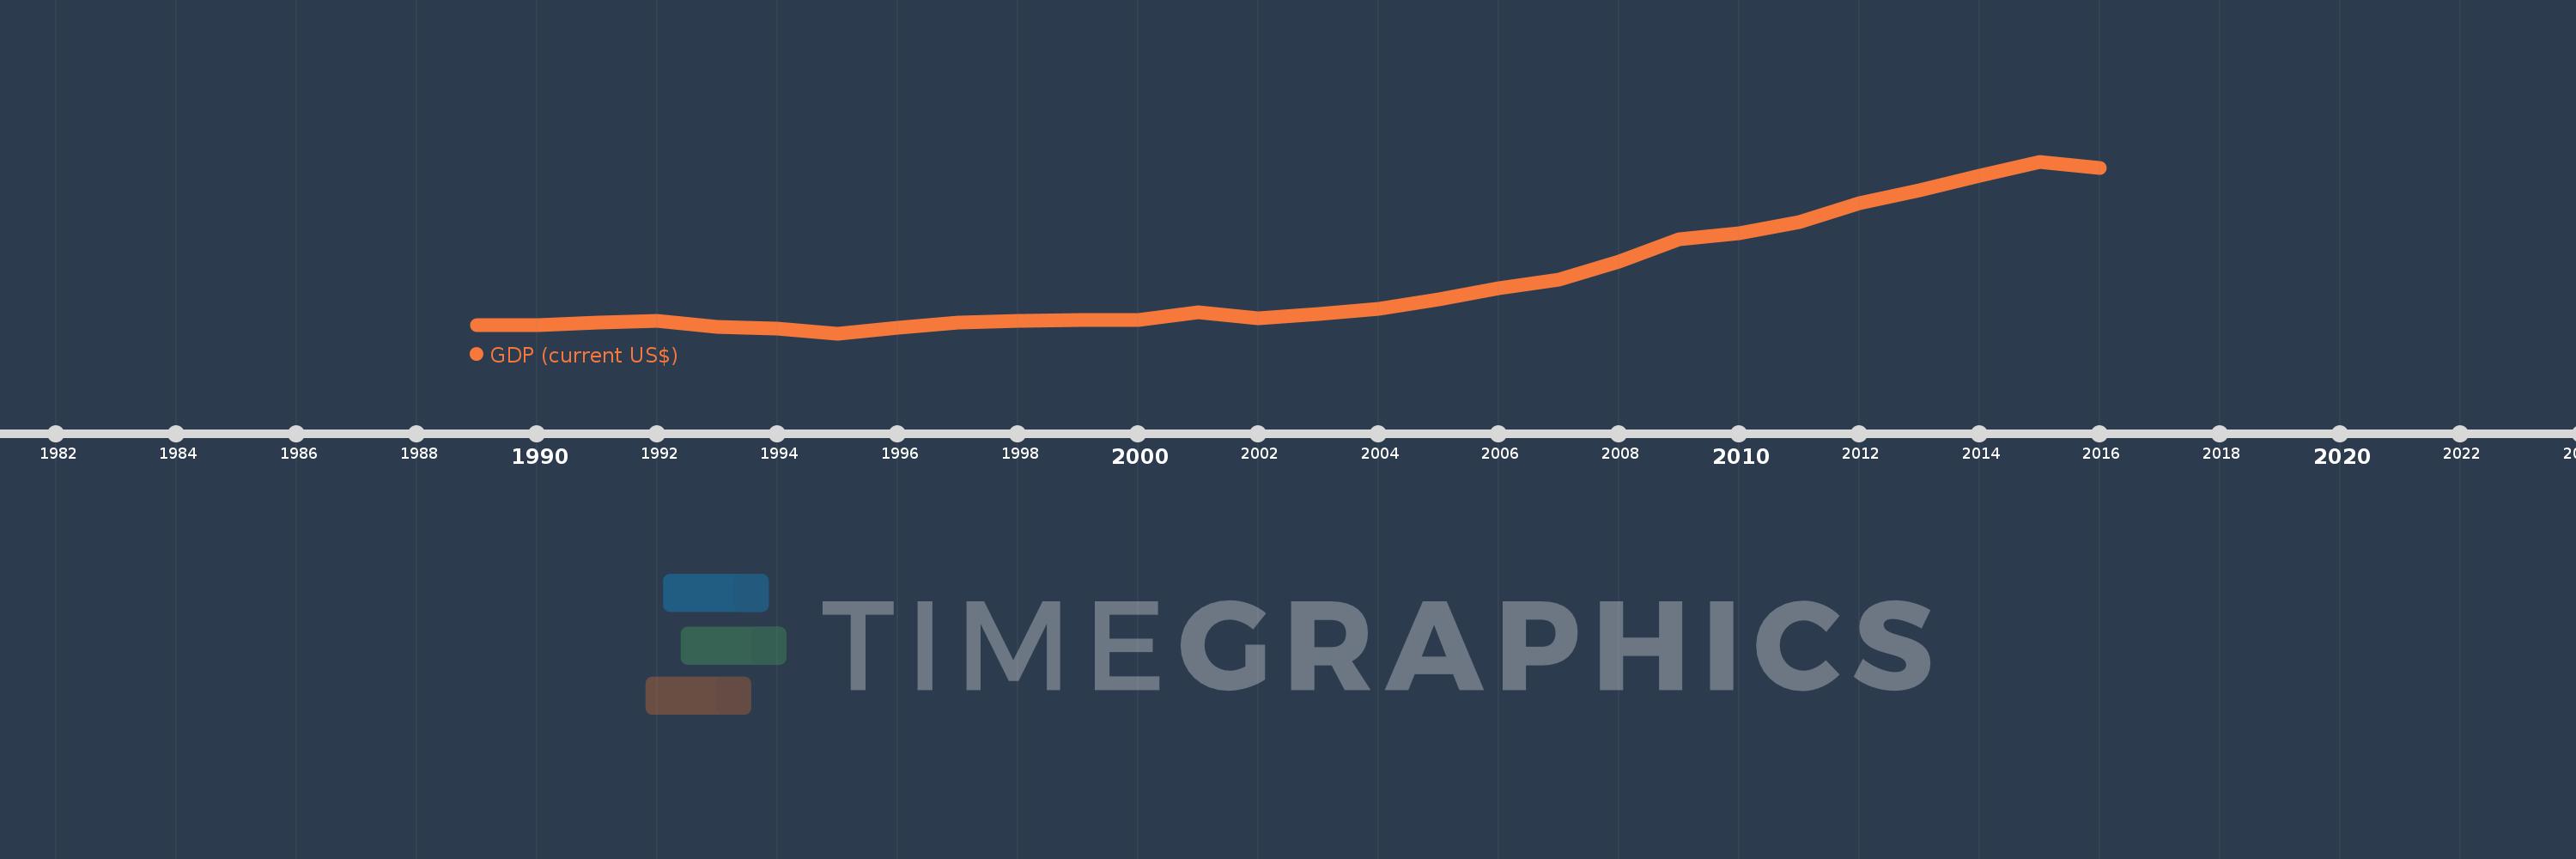
En esta escala de tiempo se presenta un gráfico de 1989 y 2016 de Low income. Los datos de 1988 están ausentes. El número de observaciones reales por fecha: 28.

Fuente (nombre):

Indicadores del desarrollo mundial

Fuente (organización):

World Bank national accounts data, and OECD National Accounts data files.

Categorías:

Economy & Growth

Se ha actualizado:

23 abr 2017 año

Los indicadores de los cambios de valor en los últimos años

En promedio:
174.321 bn
Mínimo:
73.031 bn
1 ene 1995 año
Máximo:
406.258 bn
1 ene 2015 año
A la fecha de observación
Valor
Cambio absoluto
El cambio con respecto al valor anterior
1 ene 1989 año
89.469 bn
+89.469 bn
0.0%
1 ene 1990 año
88.169 bn
-1.3 bn
-1.45%
1 ene 1991 año
94.122 bn
+5.953 bn
6.75%
1 ene 1992 año
96.724 bn
+2.602 bn
2.76%
1 ene 1993 año
85.271 bn
-11.453 bn
-11.84%
1 ene 1994 año
81.699 bn
-3.573 bn
-4.19%
1 ene 1995 año
73.031 bn
-8.668 bn
-10.61%
1 ene 1996 año
84.194 bn
+11.163 bn
15.29%
1 ene 1997 año
93.854 bn
+9.66 bn
11.47%
1 ene 1998 año
97.021 bn
+3.167 bn
3.37%
1 ene 1999 año
98.08 bn
+1.06 bn
1.09%
1 ene 2000 año
98.18 bn
+99.437 millones
0.1%
1 ene 2001 año
113.339 bn
+15.159 bn
15.44%
1 ene 2002 año
102.348 bn
-10.991 bn
-9.7%
1 ene 2003 año
110.549 bn
+8.201 bn
8.01%
1 ene 2004 año
121.296 bn
+10.747 bn
9.72%
1 ene 2005 año
138.413 bn
+17.117 bn
14.11%
1 ene 2006 año
159.878 bn
+21.465 bn
15.51%
1 ene 2007 año
177.364 bn
+17.486 bn
10.94%
1 ene 2008 año
211.506 bn
+34.142 bn
19.25%
1 ene 2009 año
254.722 bn
+43.216 bn
20.43%
1 ene 2010 año
267.332 bn
+12.61 bn
4.95%
1 ene 2011 año
289.217 bn
+21.886 bn
8.19%
1 ene 2012 año
325.885 bn
+36.668 bn
12.68%
1 ene 2013 año
350.748 bn
+24.862 bn
7.63%
1 ene 2014 año
378.049 bn
+27.301 bn
7.78%
1 ene 2015 año
406.258 bn
+28.209 bn
7.46%
1 ene 2016 año
394.274 bn
-11.984 bn
-2.95%

Ranking de los países por los datos estadísticos actuales