33
/es/
AIzaSyAYiBZKx7MnpbEhh9jyipgxe19OcubqV5w
August 1, 2025
176384
Lebanon
LBN
true
2
1
GDP (current US$)
2016,2015,2014,2013,2012,2011,2010,2009,2008,2007,2006,2005,2004,2003,2002,2001,2000,1999,1998,1997,1996,1995,1994,1993,1992,1991,1990,1989
Download
Estadísticas Globales de la Biblioteca →Lebanon →

GDP (current US$)

Estas estadísticas en otros países:

AfghanistanAlbaniaAlgeriaAndorraAngolaAntigua and BarbudaArab WorldArgentinaArmeniaArubaAustraliaAustriaAzerbaijanBahamas, TheBahrainBangladeshBarbadosBelarusBelgiumBelizeBeninBermudaBhutanBoliviaBosnia and HerzegovinaBotswanaBrazilBrunei DarussalamBulgariaBurkina FasoBurundiCabo VerdeCambodiaCameroonCanadaCaribbean small statesCayman IslandsCentral African RepublicCentral Europe and the BalticsChadChannel IslandsChileChinaColombiaComorosCongo, Dem. Rep.Congo, Rep.Costa RicaCote d'IvoireCroatiaCubaCyprusCzech RepublicDenmarkDjiboutiDominicaDominican RepublicEarly-demographic dividendEast Asia & PacificEast Asia & Pacific (excluding high income)East Asia & Pacific (IDA & IBRD countries)EcuadorEgypt, Arab Rep.El SalvadorEquatorial GuineaEritreaEstoniaEthiopiaEuro areaEurope & Central AsiaEurope & Central Asia (excluding high income)Europe & Central Asia (IDA & IBRD countries)European UnionFaroe IslandsFijiFinlandFragile and conflict affected situationsFranceFrench PolynesiaGabonGambia, TheGeorgiaGermanyGhanaGreeceGreenlandGrenadaGuatemalaGuineaGuinea-BissauGuyanaHaitiHeavily indebted poor countries (HIPC)High incomeHondurasHong Kong SAR, ChinaHungaryIBRD onlyIcelandIDA & IBRD totalIDA blendIDA onlyIDA totalIndiaIndonesiaIran, Islamic Rep.IraqIrelandIsle of ManIsraelItalyJamaicaJapanJordanKazakhstanKenyaKiribatiKorea, Rep.KosovoKuwaitKyrgyz RepublicLao PDRLate-demographic dividendLatin America & Caribbean Latin America & Caribbean (excluding high income)Latin America & the Caribbean (IDA & IBRD countries)LatviaLeast developed countries: UN classificationLebanonLesothoLiberiaLibyaLiechtensteinLithuaniaLow & middle incomeLow incomeLower middle incomeLuxembourgMacao SAR, ChinaMacedonia, FYRMadagascarMalawiMalaysiaMaldivesMaliMaltaMarshall IslandsMauritaniaMauritiusMexicoMicronesia, Fed. Sts.Middle East & North AfricaMiddle East & North Africa (excluding high income)Middle East & North Africa (IDA & IBRD countries)Middle incomeMoldovaMonacoMongoliaMontenegroMoroccoMozambiqueMyanmarNamibiaNauruNepalNetherlandsNew CaledoniaNew ZealandNicaraguaNigerNigeriaNorth AmericaNorwayOECD membersOmanOther small statesPacific island small statesPakistanPalauPanamaPapua New GuineaParaguayPeruPhilippinesPolandPortugalPost-demographic dividendPre-demographic dividendPuerto RicoQatarRomaniaRussian FederationRwandaSamoaSan MarinoSao Tome and PrincipeSaudi ArabiaSenegalSerbiaSeychellesSierra LeoneSingaporeSlovak RepublicSloveniaSmall statesSolomon IslandsSomaliaSouth AfricaSouth AsiaSouth Asia (IDA & IBRD)South SudanSpainSri LankaSt. Kitts and NevisSt. LuciaSt. Vincent and the GrenadinesSub-Saharan Africa Sub-Saharan Africa (excluding high income)Sub-Saharan Africa (IDA & IBRD countries)SudanSurinameSwazilandSwedenSwitzerlandSyrian Arab RepublicTajikistanTanzaniaThailandTimor-LesteTogoTongaTrinidad and TobagoTunisiaTurkeyTurkmenistanTuvaluUgandaUkraineUnited Arab EmiratesUnited KingdomUnited StatesUpper middle incomeUruguayUzbekistanVanuatuVenezuela, RBVietnamVirgin Islands (U.S.)West Bank and GazaWorldYemen, Rep.ZambiaZimbabwe

línea de tiempo (timeline):

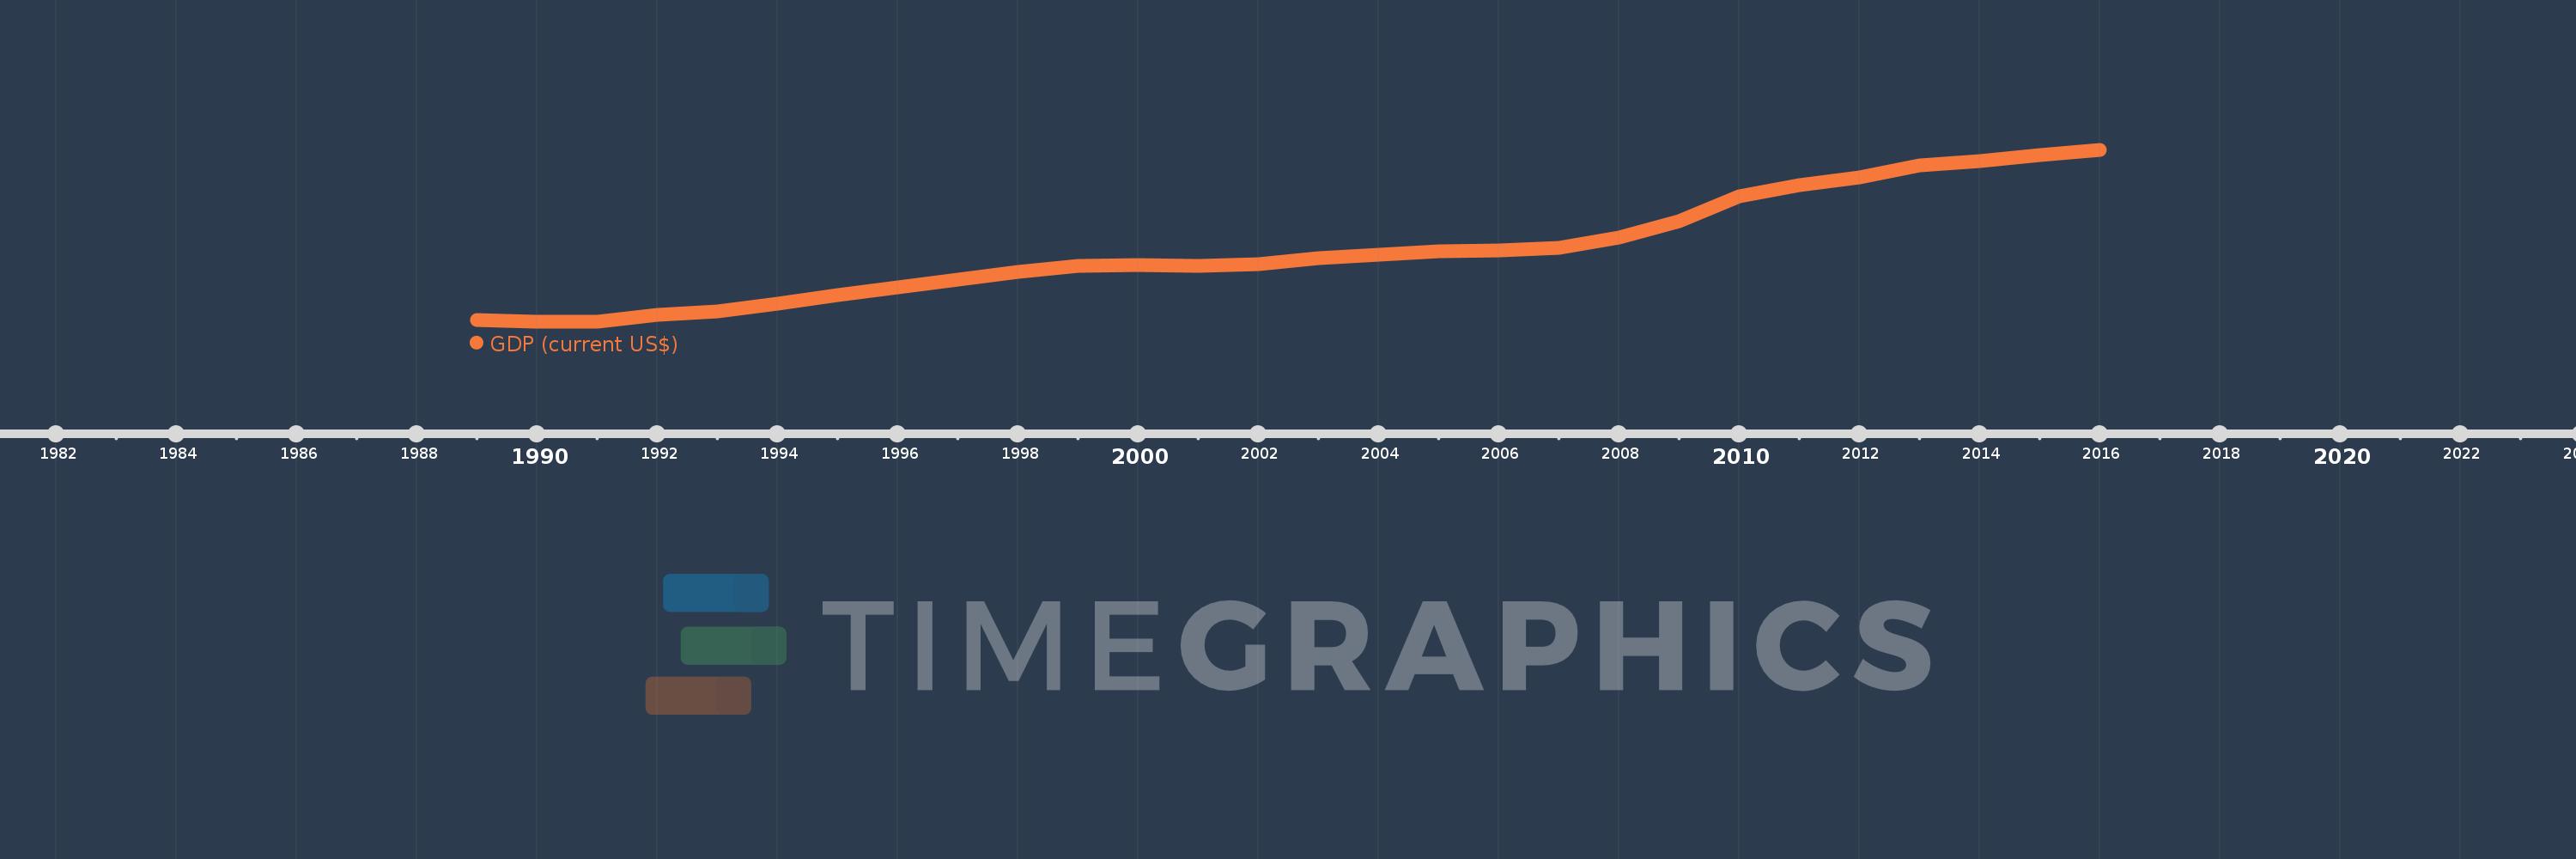
En esta escala de tiempo se presenta un gráfico de 1989 y 2016 de Lebanon. Los datos de 1988 están ausentes. El número de observaciones reales por fecha: 28.

Fuente (nombre):

Indicadores del desarrollo mundial

Fuente (organización):

World Bank national accounts data, and OECD National Accounts data files.

Categorías:

Economy & Growth

Se ha actualizado:

23 abr 2017 año

Los indicadores de los cambios de valor en los últimos años

En promedio:
21.321 bn
Mínimo:
2.718 bn
1 ene 1990 año
Máximo:
47.085 bn
1 ene 2016 año
A la fecha de observación
Valor
Cambio absoluto
El cambio con respecto al valor anterior
1 ene 1989 año
3.314 bn
+3.314 bn
0.0%
1 ene 1990 año
2.718 bn
-595.541 millones
-17.97%
1 ene 1991 año
2.838 bn
+120.487 millones
4.43%
1 ene 1992 año
4.451 bn
+1.613 bn
56.83%
1 ene 1993 año
5.546 bn
+1.094 bn
24.59%
1 ene 1994 año
7.535 bn
+1.989 bn
35.87%
1 ene 1995 año
9.599 bn
+2.064 bn
27.39%
1 ene 1996 año
11.719 bn
+2.12 bn
22.08%
1 ene 1997 año
13.69 bn
+1.971 bn
16.82%
1 ene 1998 año
15.752 bn
+2.062 bn
15.06%
1 ene 1999 año
17.247 bn
+1.495 bn
9.49%
1 ene 2000 año
17.391 bn
+143.877 millones
0.83%
1 ene 2001 año
17.26 bn
-130.692 millones
-0.75%
1 ene 2002 año
17.65 bn
+389.386 millones
2.26%
1 ene 2003 año
19.152 bn
+1.502 bn
8.51%
1 ene 2004 año
20.083 bn
+930.68 millones
4.86%
1 ene 2005 año
20.955 bn
+872.305 millones
4.34%
1 ene 2006 año
21.288 bn
+332.338 millones
1.59%
1 ene 2007 año
21.796 bn
+508.789 millones
2.39%
1 ene 2008 año
24.577 bn
+2.781 bn
12.76%
1 ene 2009 año
28.83 bn
+4.253 bn
17.3%
1 ene 2010 año
35.14 bn
+6.31 bn
21.89%
1 ene 2011 año
38.01 bn
+2.87 bn
8.17%
1 ene 2012 año
40.079 bn
+2.069 bn
5.44%
1 ene 2013 año
43.205 bn
+3.126 bn
7.8%
1 ene 2014 año
44.352 bn
+1.147 bn
2.66%
1 ene 2015 año
45.731 bn
+1.379 bn
3.11%
1 ene 2016 año
47.085 bn
+1.354 bn
2.96%

Ranking de los países por los datos estadísticos actuales