33
/es/
AIzaSyAYiBZKx7MnpbEhh9jyipgxe19OcubqV5w
August 1, 2025
260891
Tanzania
TZA
true
2
1
GDP (current US$)
2016,2015,2014,2013,2012,2011,2010,2009,2008,2007,2006,2005,2004,2003,2002,2001,2000,1999,1998,1997,1996,1995,1994,1993,1992,1991,1990,1989
Download
Estadísticas Globales de la Biblioteca →Tanzania →

GDP (current US$)

Estas estadísticas en otros países:

AfghanistanAlbaniaAlgeriaAndorraAngolaAntigua and BarbudaArab WorldArgentinaArmeniaArubaAustraliaAustriaAzerbaijanBahamas, TheBahrainBangladeshBarbadosBelarusBelgiumBelizeBeninBermudaBhutanBoliviaBosnia and HerzegovinaBotswanaBrazilBrunei DarussalamBulgariaBurkina FasoBurundiCabo VerdeCambodiaCameroonCanadaCaribbean small statesCayman IslandsCentral African RepublicCentral Europe and the BalticsChadChannel IslandsChileChinaColombiaComorosCongo, Dem. Rep.Congo, Rep.Costa RicaCote d'IvoireCroatiaCubaCyprusCzech RepublicDenmarkDjiboutiDominicaDominican RepublicEarly-demographic dividendEast Asia & PacificEast Asia & Pacific (excluding high income)East Asia & Pacific (IDA & IBRD countries)EcuadorEgypt, Arab Rep.El SalvadorEquatorial GuineaEritreaEstoniaEthiopiaEuro areaEurope & Central AsiaEurope & Central Asia (excluding high income)Europe & Central Asia (IDA & IBRD countries)European UnionFaroe IslandsFijiFinlandFragile and conflict affected situationsFranceFrench PolynesiaGabonGambia, TheGeorgiaGermanyGhanaGreeceGreenlandGrenadaGuatemalaGuineaGuinea-BissauGuyanaHaitiHeavily indebted poor countries (HIPC)High incomeHondurasHong Kong SAR, ChinaHungaryIBRD onlyIcelandIDA & IBRD totalIDA blendIDA onlyIDA totalIndiaIndonesiaIran, Islamic Rep.IraqIrelandIsle of ManIsraelItalyJamaicaJapanJordanKazakhstanKenyaKiribatiKorea, Rep.KosovoKuwaitKyrgyz RepublicLao PDRLate-demographic dividendLatin America & Caribbean Latin America & Caribbean (excluding high income)Latin America & the Caribbean (IDA & IBRD countries)LatviaLeast developed countries: UN classificationLebanonLesothoLiberiaLibyaLiechtensteinLithuaniaLow & middle incomeLow incomeLower middle incomeLuxembourgMacao SAR, ChinaMacedonia, FYRMadagascarMalawiMalaysiaMaldivesMaliMaltaMarshall IslandsMauritaniaMauritiusMexicoMicronesia, Fed. Sts.Middle East & North AfricaMiddle East & North Africa (excluding high income)Middle East & North Africa (IDA & IBRD countries)Middle incomeMoldovaMonacoMongoliaMontenegroMoroccoMozambiqueMyanmarNamibiaNauruNepalNetherlandsNew CaledoniaNew ZealandNicaraguaNigerNigeriaNorth AmericaNorwayOECD membersOmanOther small statesPacific island small statesPakistanPalauPanamaPapua New GuineaParaguayPeruPhilippinesPolandPortugalPost-demographic dividendPre-demographic dividendPuerto RicoQatarRomaniaRussian FederationRwandaSamoaSan MarinoSao Tome and PrincipeSaudi ArabiaSenegalSerbiaSeychellesSierra LeoneSingaporeSlovak RepublicSloveniaSmall statesSolomon IslandsSomaliaSouth AfricaSouth AsiaSouth Asia (IDA & IBRD)South SudanSpainSri LankaSt. Kitts and NevisSt. LuciaSt. Vincent and the GrenadinesSub-Saharan Africa Sub-Saharan Africa (excluding high income)Sub-Saharan Africa (IDA & IBRD countries)SudanSurinameSwazilandSwedenSwitzerlandSyrian Arab RepublicTajikistanTanzaniaThailandTimor-LesteTogoTongaTrinidad and TobagoTunisiaTurkeyTurkmenistanTuvaluUgandaUkraineUnited Arab EmiratesUnited KingdomUnited StatesUpper middle incomeUruguayUzbekistanVanuatuVenezuela, RBVietnamVirgin Islands (U.S.)West Bank and GazaWorldYemen, Rep.ZambiaZimbabwe

línea de tiempo (timeline):

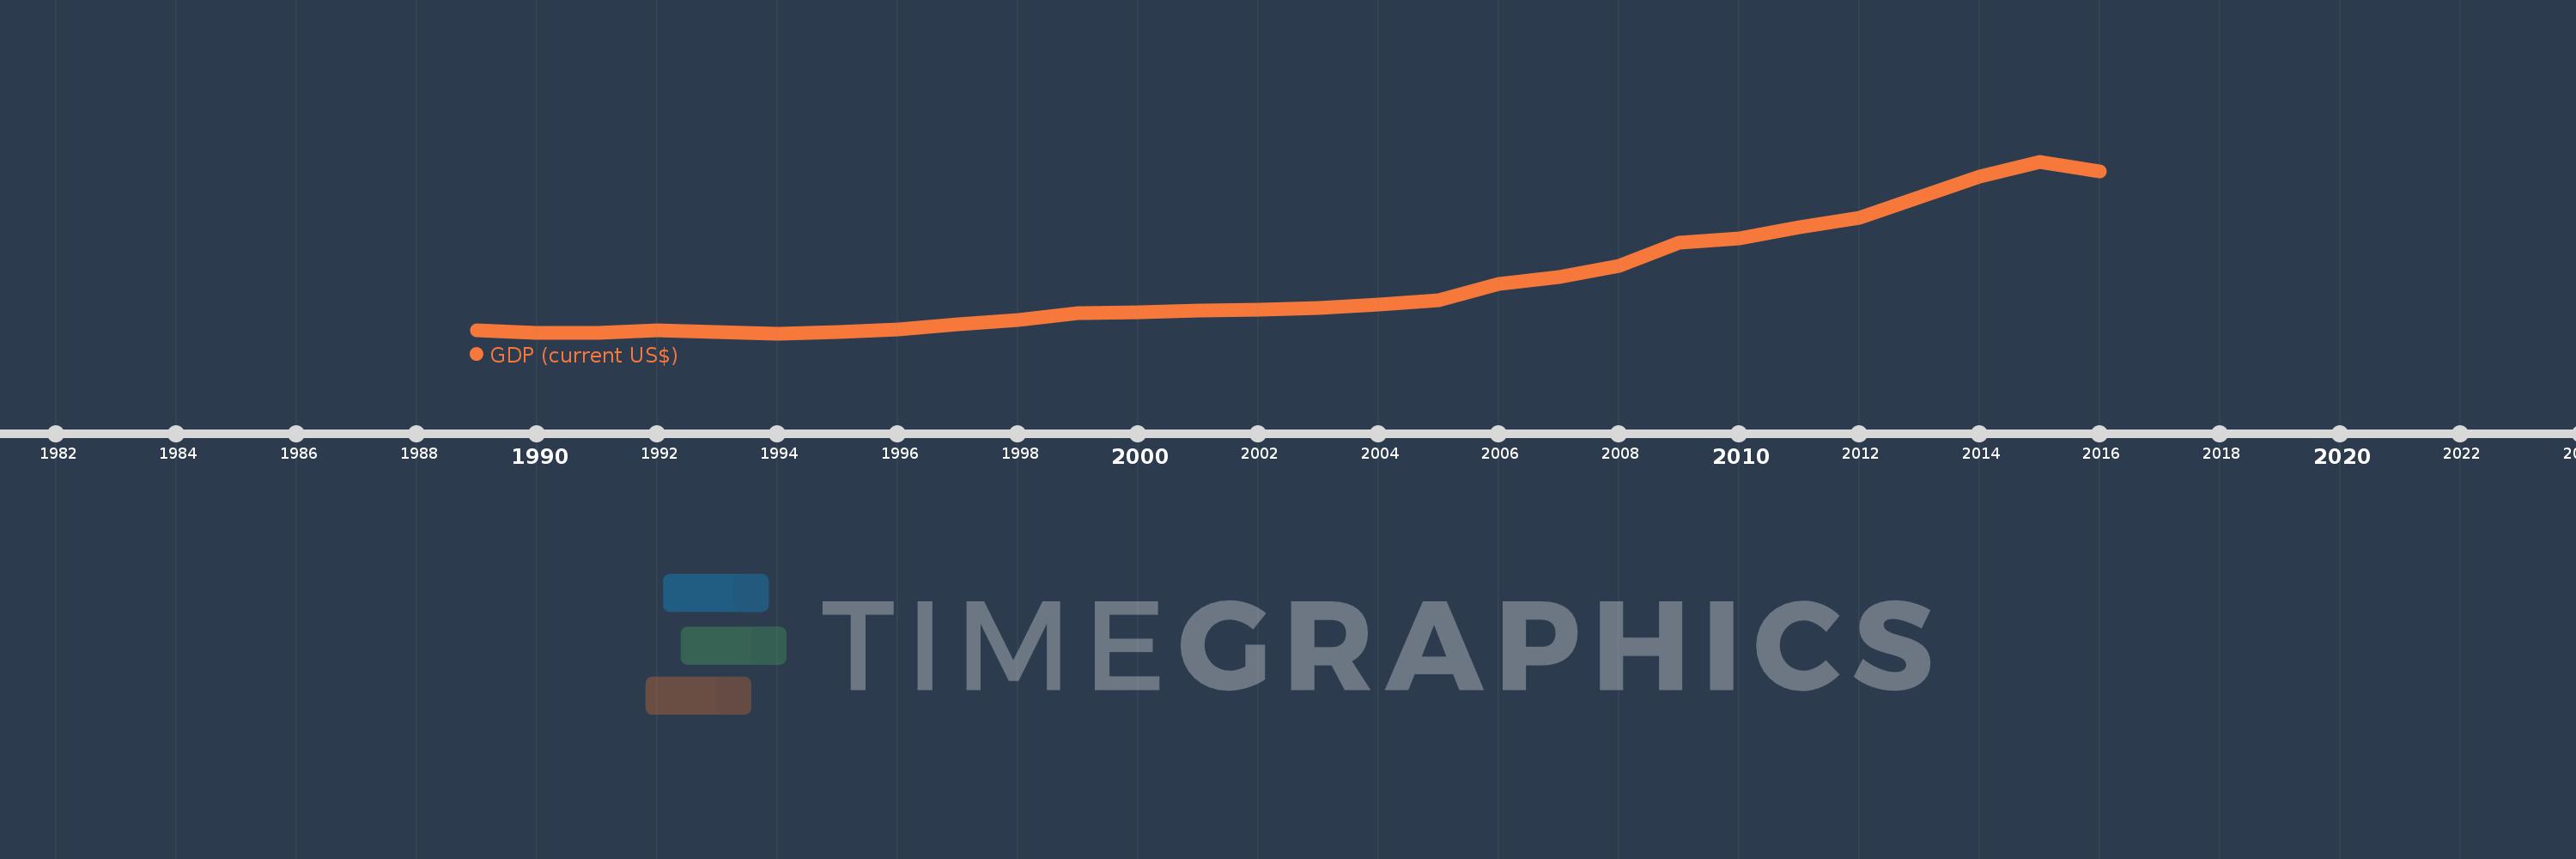
En esta escala de tiempo se presenta un gráfico de 1989 y 2016 de Tanzania. Los datos de 1988 están ausentes. El número de observaciones reales por fecha: 28.

Fuente (nombre):

Indicadores del desarrollo mundial

Fuente (organización):

World Bank national accounts data, and OECD National Accounts data files.

Categorías:

Economy & Growth

Se ha actualizado:

23 abr 2017 año

Los indicadores de los cambios de valor en los últimos años

En promedio:
17.213 bn
Mínimo:
4.258 bn
1 ene 1994 año
Máximo:
48.197 bn
1 ene 2015 año
A la fecha de observación
Valor
Cambio absoluto
El cambio con respecto al valor anterior
1 ene 1989 año
5.1 bn
+5.1 bn
0.0%
1 ene 1990 año
4.42 bn
-680.238 millones
-13.34%
1 ene 1991 año
4.259 bn
-161.425 millones
-3.65%
1 ene 1992 año
4.957 bn
+697.845 millones
16.39%
1 ene 1993 año
4.601 bn
-355.175 millones
-7.17%
1 ene 1994 año
4.258 bn
-343.711 millones
-7.47%
1 ene 1995 año
4.511 bn
+253.145 millones
5.95%
1 ene 1996 año
5.255 bn
+744.374 millones
16.5%
1 ene 1997 año
6.496 bn
+1.241 bn
23.61%
1 ene 1998 año
7.684 bn
+1.188 bn
18.28%
1 ene 1999 año
9.345 bn
+1.661 bn
21.62%
1 ene 2000 año
9.698 bn
+352.673 millones
3.77%
1 ene 2001 año
10.186 bn
+487.939 millones
5.03%
1 ene 2002 año
10.384 bn
+197.774 millones
1.94%
1 ene 2003 año
10.806 bn
+422.039 millones
4.06%
1 ene 2004 año
11.659 bn
+853.53 millones
7.9%
1 ene 2005 año
12.826 bn
+1.167 bn
10.01%
1 ene 2006 año
16.93 bn
+4.104 bn
32.0%
1 ene 2007 año
18.61 bn
+1.68 bn
9.93%
1 ene 2008 año
21.502 bn
+2.891 bn
15.54%
1 ene 2009 año
27.368 bn
+5.867 bn
27.28%
1 ene 2010 año
28.574 bn
+1.205 bn
4.4%
1 ene 2011 año
31.408 bn
+2.834 bn
9.92%
1 ene 2012 año
33.879 bn
+2.471 bn
7.87%
1 ene 2013 año
39.088 bn
+5.209 bn
15.38%
1 ene 2014 año
44.333 bn
+5.246 bn
13.42%
1 ene 2015 año
48.197 bn
+3.864 bn
8.72%
1 ene 2016 año
45.628 bn
-2.569 bn
-5.33%

Ranking de los países por los datos estadísticos actuales