29
/es/
es
AIzaSyAYiBZKx7MnpbEhh9jyipgxe19OcubqV5w
April 1, 2024
283610
West Bank and Gaza
PSE
true
2
1
GDP (constant LCU)
2016,2015,2014,2013,2012,2011,2010,2009,2008,2007,2006,2005,2004,2003,2002,2001,2000,1999,1998,1997,1996,1995
Download
Estadísticas Globales de la Biblioteca →West Bank and Gaza →

GDP (constant LCU)

Estas estadísticas en otros países:
AfghanistanAlbaniaAlgeriaAndorraAngolaAntigua and BarbudaArgentinaArmeniaArubaAustraliaAustriaAzerbaijanBahamas, TheBahrainBangladeshBarbadosBelarusBelgiumBelizeBeninBermudaBhutanBoliviaBosnia and HerzegovinaBotswanaBrazilBrunei DarussalamBulgariaBurkina FasoBurundiCabo VerdeCambodiaCameroonCanadaCayman IslandsCentral African RepublicChadChannel IslandsChileChinaColombiaComorosCongo, Dem. Rep.Congo, Rep.Costa RicaCote d'IvoireCroatiaCubaCyprusCzech RepublicDenmarkDjiboutiDominicaDominican RepublicEcuadorEgypt, Arab Rep.El SalvadorEquatorial GuineaEritreaEstoniaEthiopiaFijiFinlandFranceFrench PolynesiaGabonGambia, TheGeorgiaGermanyGhanaGreeceGreenlandGrenadaGuatemalaGuineaGuinea-BissauGuyanaHaitiHondurasHong Kong SAR, ChinaHungaryIcelandIndiaIndonesiaIran, Islamic Rep.IraqIrelandIsle of ManIsraelItalyJamaicaJapanJordanKazakhstanKenyaKiribatiKorea, Rep.KosovoKuwaitKyrgyz RepublicLao PDRLatviaLebanonLesothoLiberiaLibyaLiechtensteinLithuaniaLuxembourgMacao SAR, ChinaMacedonia, FYRMadagascarMalawiMalaysiaMaldivesMaliMaltaMarshall IslandsMauritaniaMauritiusMexicoMicronesia, Fed. Sts.MoldovaMonacoMongoliaMontenegroMoroccoMozambiqueMyanmarNamibiaNauruNepalNetherlandsNew CaledoniaNew ZealandNicaraguaNigerNigeriaNorwayOmanPakistanPalauPanamaPapua New GuineaParaguayPeruPhilippinesPolandPortugalPuerto RicoQatarRomaniaRussian FederationRwandaSamoaSan MarinoSao Tome and PrincipeSaudi ArabiaSenegalSerbiaSeychellesSierra LeoneSingaporeSlovak RepublicSloveniaSolomon IslandsSomaliaSouth AfricaSouth SudanSpainSri LankaSt. Kitts and NevisSt. LuciaSt. Vincent and the GrenadinesSudanSurinameSwazilandSwedenSwitzerlandSyrian Arab RepublicTajikistanTanzaniaThailandTimor-LesteTogoTongaTrinidad and TobagoTunisiaTurkeyTurkmenistanTuvaluUgandaUkraineUnited Arab EmiratesUnited KingdomUnited StatesUruguayUzbekistanVanuatuVenezuela, RBVietnamVirgin Islands (U.S.)West Bank and GazaYemen, Rep.ZambiaZimbabwe
línea de tiempo (timeline):
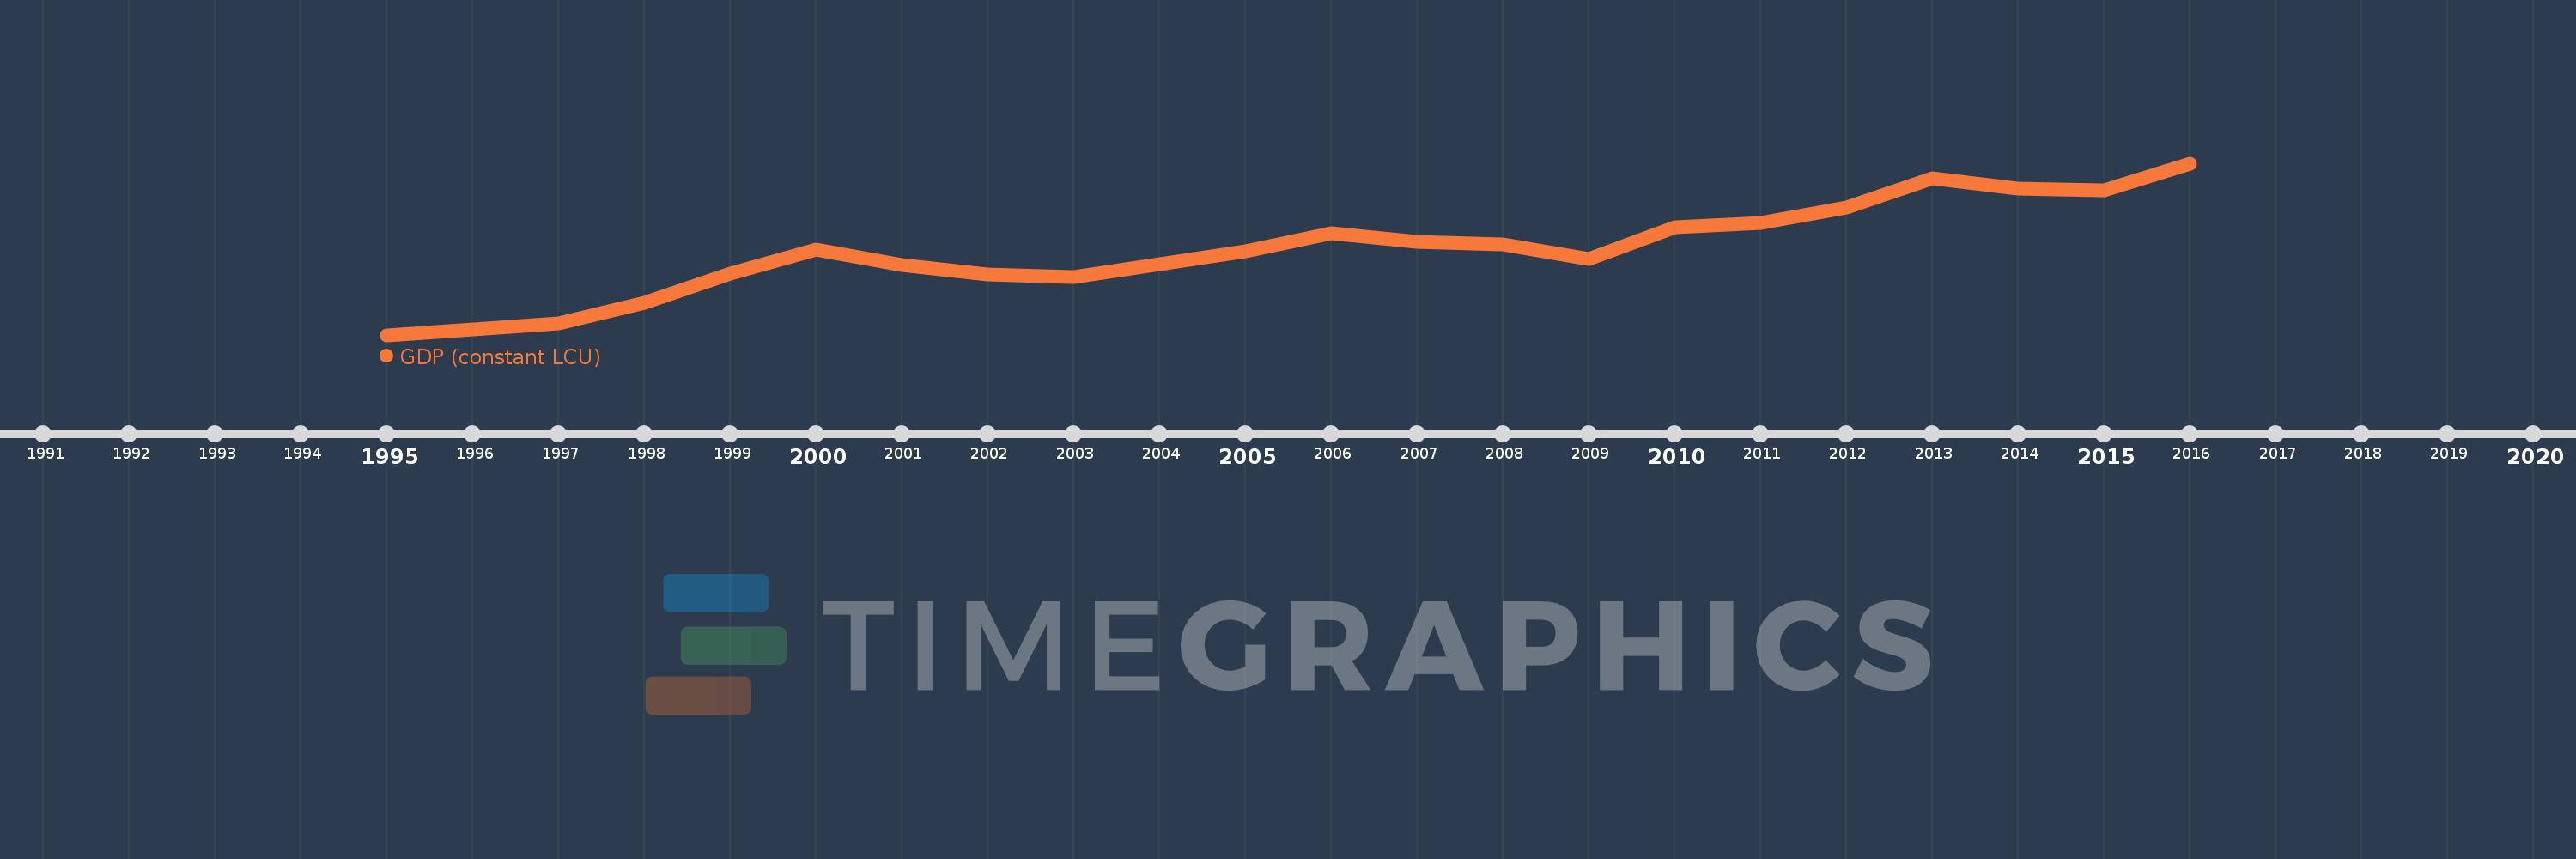
En esta escala de tiempo se presenta un gráfico de 1995 y 2016 de West Bank and Gaza. Los datos de 1994 están ausentes. El número de observaciones reales por fecha: 22.
Fuente (nombre):
Indicadores del desarrollo mundial
Fuente (organización):
World Bank national accounts data, and OECD National Accounts data files.
Categorías:
Economy & Growth
Se ha actualizado:
23 abr 2017 año
Los indicadores de los cambios de valor en los últimos años
En promedio:
19.524 bn
Mínimo:
9.276 bn
1 ene 1995 año
Máximo:
30.013 bn
1 ene 2016 año
A la fecha de observación
Valor
Cambio absoluto
El cambio con respecto al valor anterior
1 ene 1995 año
9.276 bn
+9.276 bn
0.0%
1 ene 1996 año
9.937 bn
+660.994 millones
7.13%
1 ene 1997 año
10.661 bn
+723.307 millones
7.28%
1 ene 1998 año
13.212 bn
+2.552 bn
23.94%
1 ene 1999 año
16.641 bn
+3.428 bn
25.95%
1 ene 2000 año
19.629 bn
+2.988 bn
17.96%
1 ene 2001 año
17.679 bn
-1.95 bn
-9.93%
1 ene 2002 año
16.538 bn
-1.141 bn
-6.45%
1 ene 2003 año
16.303 bn
-234.41 millones
-1.42%
1 ene 2004 año
17.851 bn
+1.548 bn
9.5%
1 ene 2005 año
19.403 bn
+1.552 bn
8.69%
1 ene 2006 año
21.526 bn
+2.123 bn
10.94%
1 ene 2007 año
20.539 bn
-986.695 millones
-4.58%
1 ene 2008 año
20.185 bn
-354.717 millones
-1.73%
1 ene 2009 año
18.451 bn
-1.734 bn
-8.59%
1 ene 2010 año
22.315 bn
+3.864 bn
20.94%
1 ene 2011 año
22.836 bn
+521.595 millones
2.34%
1 ene 2012 año
24.626 bn
+1.789 bn
7.84%
1 ene 2013 año
28.205 bn
+3.58 bn
14.54%
1 ene 2014 año
26.998 bn
-1.207 bn
-4.28%
1 ene 2015 año
26.703 bn
-294.653 millones
-1.09%
1 ene 2016 año
30.013 bn
+3.309 bn
12.39%
Ranking de los países por los datos estadísticos actuales

Comentarios:

Enviar
PremiumAbout & FeedbackAcuerdoPrivacidad
logo
© 2022 Selected Technologies LLC – Morgan Hill, California