33
/es/
AIzaSyAYiBZKx7MnpbEhh9jyipgxe19OcubqV5w
August 1, 2025
273574
Ukraine
UKR
true
2
1
GDP (constant LCU)
2016,2015,2014,2013,2012,2011,2010,2009,2008,2007,2006,2005,2004,2003,2002,2001,2000,1999,1998,1997,1996,1995,1994,1993,1992,1991,1990,1989,1988
Download
Estadísticas Globales de la Biblioteca →Ukraine →

GDP (constant LCU)

Estas estadísticas en otros países:

AfghanistanAlbaniaAlgeriaAndorraAngolaAntigua and BarbudaArgentinaArmeniaArubaAustraliaAustriaAzerbaijanBahamas, TheBahrainBangladeshBarbadosBelarusBelgiumBelizeBeninBermudaBhutanBoliviaBosnia and HerzegovinaBotswanaBrazilBrunei DarussalamBulgariaBurkina FasoBurundiCabo VerdeCambodiaCameroonCanadaCayman IslandsCentral African RepublicChadChannel IslandsChileChinaColombiaComorosCongo, Dem. Rep.Congo, Rep.Costa RicaCote d'IvoireCroatiaCubaCyprusCzech RepublicDenmarkDjiboutiDominicaDominican RepublicEcuadorEgypt, Arab Rep.El SalvadorEquatorial GuineaEritreaEstoniaEthiopiaFijiFinlandFranceFrench PolynesiaGabonGambia, TheGeorgiaGermanyGhanaGreeceGreenlandGrenadaGuatemalaGuineaGuinea-BissauGuyanaHaitiHondurasHong Kong SAR, ChinaHungaryIcelandIndiaIndonesiaIran, Islamic Rep.IraqIrelandIsle of ManIsraelItalyJamaicaJapanJordanKazakhstanKenyaKiribatiKorea, Rep.KosovoKuwaitKyrgyz RepublicLao PDRLatviaLebanonLesothoLiberiaLibyaLiechtensteinLithuaniaLuxembourgMacao SAR, ChinaMacedonia, FYRMadagascarMalawiMalaysiaMaldivesMaliMaltaMarshall IslandsMauritaniaMauritiusMexicoMicronesia, Fed. Sts.MoldovaMonacoMongoliaMontenegroMoroccoMozambiqueMyanmarNamibiaNauruNepalNetherlandsNew CaledoniaNew ZealandNicaraguaNigerNigeriaNorwayOmanPakistanPalauPanamaPapua New GuineaParaguayPeruPhilippinesPolandPortugalPuerto RicoQatarRomaniaRussian FederationRwandaSamoaSan MarinoSao Tome and PrincipeSaudi ArabiaSenegalSerbiaSeychellesSierra LeoneSingaporeSlovak RepublicSloveniaSolomon IslandsSomaliaSouth AfricaSouth SudanSpainSri LankaSt. Kitts and NevisSt. LuciaSt. Vincent and the GrenadinesSudanSurinameSwazilandSwedenSwitzerlandSyrian Arab RepublicTajikistanTanzaniaThailandTimor-LesteTogoTongaTrinidad and TobagoTunisiaTurkeyTurkmenistanTuvaluUgandaUkraineUnited Arab EmiratesUnited KingdomUnited StatesUruguayUzbekistanVanuatuVenezuela, RBVietnamVirgin Islands (U.S.)West Bank and GazaYemen, Rep.ZambiaZimbabwe

línea de tiempo (timeline):

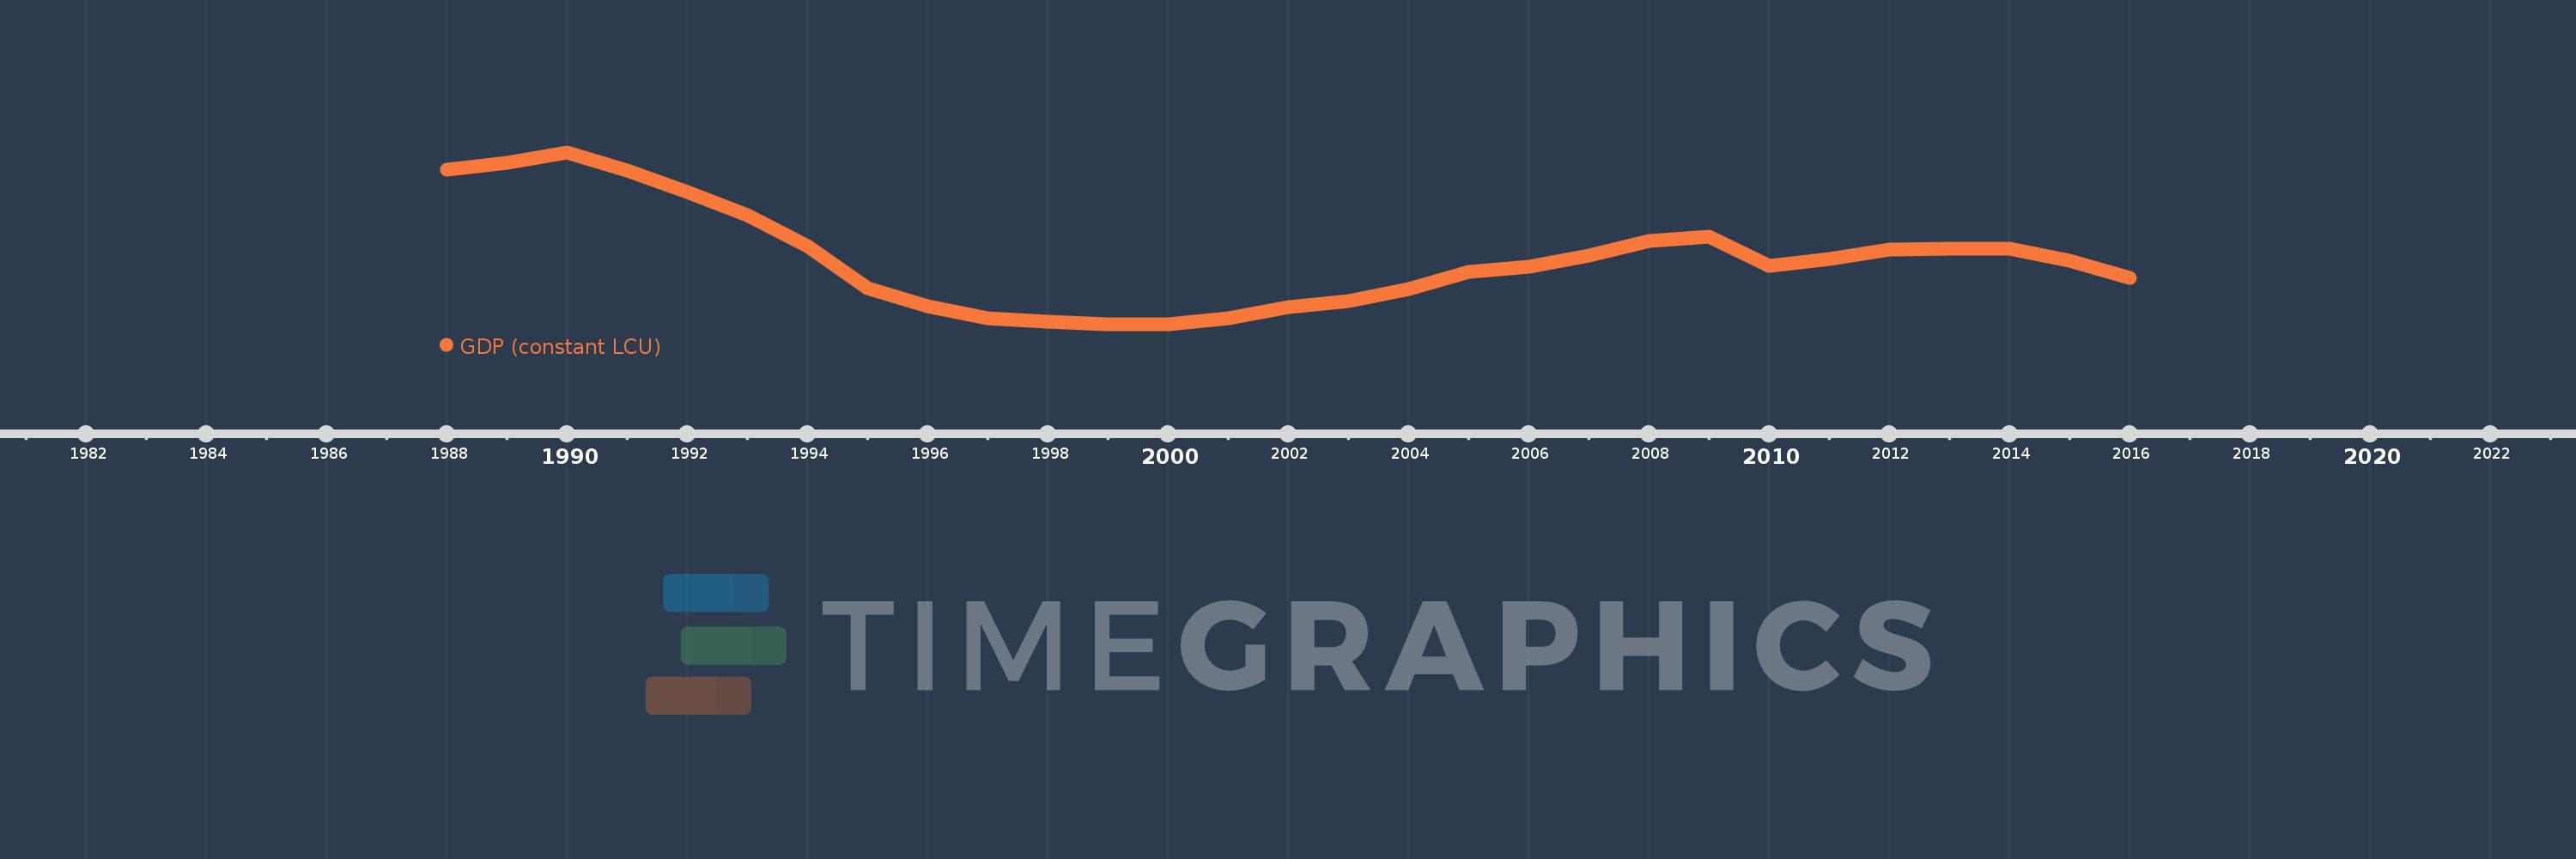
En esta escala de tiempo se presenta un gráfico de 1988 y 2016 de Ukraine. Los datos de 1987 están ausentes. El número de observaciones reales por fecha: 29.

Fuente (nombre):

Indicadores del desarrollo mundial

Fuente (organización):

World Bank national accounts data, and OECD National Accounts data files.

Categorías:

Economy & Growth

Se ha actualizado:

23 abr 2017 año

Los indicadores de los cambios de valor en los últimos años

En promedio:
1.082 billones
Mínimo:
669.929 bn
1 ene 2000 año
Máximo:
1.744 billones
1 ene 1990 año
A la fecha de observación
Valor
Cambio absoluto
El cambio con respecto al valor anterior
1 ene 1988 año
1.637 billones
+1.637 billones
0.0%
1 ene 1989 año
1.679 billones
+42.001 bn
2.57%
1 ene 1990 año
1.744 billones
+65.012 bn
3.87%
1 ene 1991 año
1.633 billones
-110.633 bn
-6.35%
1 ene 1992 año
1.496 billones
-137.339 bn
-8.41%
1 ene 1993 año
1.351 billones
-145.056 bn
-9.7%
1 ene 1994 año
1.158 billones
-192.127 bn
-14.23%
1 ene 1995 año
892.731 bn
-265.668 bn
-22.93%
1 ene 1996 año
783.818 bn
-108.913 bn
-12.2%
1 ene 1997 año
705.436 bn
-78.382 bn
-10.0%
1 ene 1998 año
684.273 bn
-21.163 bn
-3.0%
1 ene 1999 año
671.272 bn
-13.001 bn
-1.9%
1 ene 2000 año
669.929 bn
-1.343 bn
-0.2%
1 ene 2001 año
709.455 bn
+39.526 bn
5.9%
1 ene 2002 año
774.725 bn
+65.27 bn
9.2%
1 ene 2003 año
815.01 bn
+40.286 bn
5.2%
1 ene 2004 año
891.621 bn
+76.611 bn
9.4%
1 ene 2005 año
999.508 bn
+107.886 bn
12.1%
1 ene 2006 año
1.026 billones
+26.987 bn
2.7%
1 ene 2007 año
1.101 billones
+74.934 bn
7.3%
1 ene 2008 año
1.188 billones
+87.013 bn
7.9%
1 ene 2009 año
1.216 billones
+27.334 bn
2.3%
1 ene 2010 año
1.036 billones
-179.935 bn
-14.8%
1 ene 2011 año
1.079 billones
+43.505 bn
4.2%
1 ene 2012 año
1.138 billones
+58.992 bn
5.47%
1 ene 2013 año
1.141 billones
+2.717 bn
0.24%
1 ene 2014 año
1.141 billones
-305.0 millones
-0.03%
1 ene 2015 año
1.066 billones
-74.749 bn
-6.55%
1 ene 2016 año
960.789 bn
-105.212 bn
-9.87%

Ranking de los países por los datos estadísticos actuales