33
/es/
AIzaSyAYiBZKx7MnpbEhh9jyipgxe19OcubqV5w
August 1, 2025
119869
Djibouti
DJI
true
2
1
GDP (constant LCU)
2016,2015,2014,2013,2012,2011,2010,2009,2008,2007,2006,2005,2004,2003,2002,2001,2000,1999,1998,1997,1996,1995,1994,1993,1992,1991
Download
Estadísticas Globales de la Biblioteca →Djibouti →

GDP (constant LCU)

Estas estadísticas en otros países:

AfghanistanAlbaniaAlgeriaAndorraAngolaAntigua and BarbudaArgentinaArmeniaArubaAustraliaAustriaAzerbaijanBahamas, TheBahrainBangladeshBarbadosBelarusBelgiumBelizeBeninBermudaBhutanBoliviaBosnia and HerzegovinaBotswanaBrazilBrunei DarussalamBulgariaBurkina FasoBurundiCabo VerdeCambodiaCameroonCanadaCayman IslandsCentral African RepublicChadChannel IslandsChileChinaColombiaComorosCongo, Dem. Rep.Congo, Rep.Costa RicaCote d'IvoireCroatiaCubaCyprusCzech RepublicDenmarkDjiboutiDominicaDominican RepublicEcuadorEgypt, Arab Rep.El SalvadorEquatorial GuineaEritreaEstoniaEthiopiaFijiFinlandFranceFrench PolynesiaGabonGambia, TheGeorgiaGermanyGhanaGreeceGreenlandGrenadaGuatemalaGuineaGuinea-BissauGuyanaHaitiHondurasHong Kong SAR, ChinaHungaryIcelandIndiaIndonesiaIran, Islamic Rep.IraqIrelandIsle of ManIsraelItalyJamaicaJapanJordanKazakhstanKenyaKiribatiKorea, Rep.KosovoKuwaitKyrgyz RepublicLao PDRLatviaLebanonLesothoLiberiaLibyaLiechtensteinLithuaniaLuxembourgMacao SAR, ChinaMacedonia, FYRMadagascarMalawiMalaysiaMaldivesMaliMaltaMarshall IslandsMauritaniaMauritiusMexicoMicronesia, Fed. Sts.MoldovaMonacoMongoliaMontenegroMoroccoMozambiqueMyanmarNamibiaNauruNepalNetherlandsNew CaledoniaNew ZealandNicaraguaNigerNigeriaNorwayOmanPakistanPalauPanamaPapua New GuineaParaguayPeruPhilippinesPolandPortugalPuerto RicoQatarRomaniaRussian FederationRwandaSamoaSan MarinoSao Tome and PrincipeSaudi ArabiaSenegalSerbiaSeychellesSierra LeoneSingaporeSlovak RepublicSloveniaSolomon IslandsSomaliaSouth AfricaSouth SudanSpainSri LankaSt. Kitts and NevisSt. LuciaSt. Vincent and the GrenadinesSudanSurinameSwazilandSwedenSwitzerlandSyrian Arab RepublicTajikistanTanzaniaThailandTimor-LesteTogoTongaTrinidad and TobagoTunisiaTurkeyTurkmenistanTuvaluUgandaUkraineUnited Arab EmiratesUnited KingdomUnited StatesUruguayUzbekistanVanuatuVenezuela, RBVietnamVirgin Islands (U.S.)West Bank and GazaYemen, Rep.ZambiaZimbabwe

línea de tiempo (timeline):

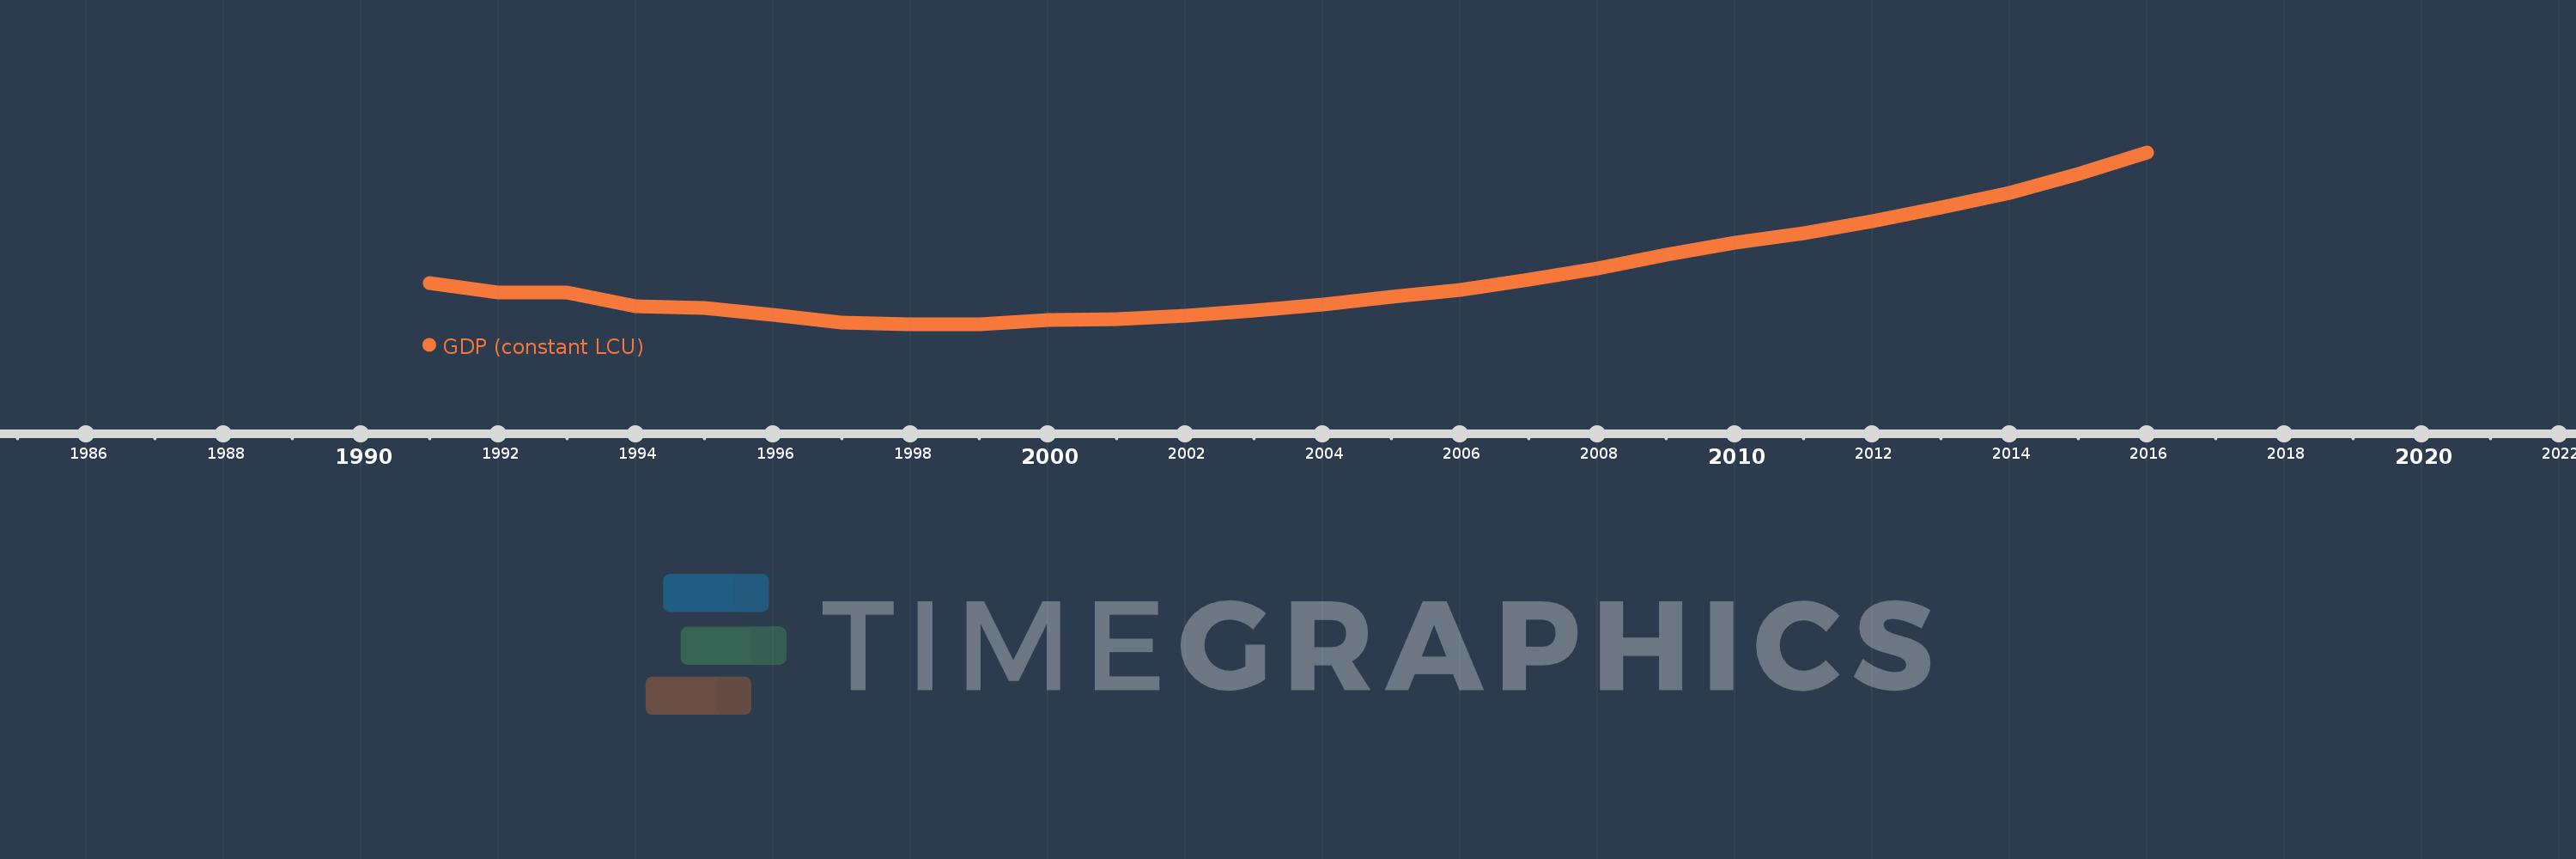
En esta escala de tiempo se presenta un gráfico de 1991 y 2016 de Djibouti. Los datos de 1990 están ausentes. El número de observaciones reales por fecha: 26.

Fuente (nombre):

Indicadores del desarrollo mundial

Fuente (organización):

World Bank national accounts data, and OECD National Accounts data files.

Categorías:

Economy & Growth

Se ha actualizado:

23 abr 2017 año

Los indicadores de los cambios de valor en los últimos años

En promedio:
83.228 bn
Mínimo:
65.368 bn
1 ene 1998 año
Máximo:
127.807 bn
1 ene 2016 año
A la fecha de observación
Valor
Cambio absoluto
El cambio con respecto al valor anterior
1 ene 1991 año
80.388 bn
+80.388 bn
0.0%
1 ene 1992 año
76.95 bn
-3.439 bn
-4.28%
1 ene 1993 año
76.936 bn
-13.825 millones
-0.02%
1 ene 1994 año
71.842 bn
-5.094 bn
-6.62%
1 ene 1995 año
71.168 bn
-673.404 millones
-0.94%
1 ene 1996 año
68.686 bn
-2.483 bn
-3.49%
1 ene 1997 año
65.859 bn
-2.827 bn
-4.12%
1 ene 1998 año
65.368 bn
-491.225 millones
-0.75%
1 ene 1999 año
65.433 bn
+64.962 millones
0.1%
1 ene 2000 año
66.859 bn
+1.426 bn
2.18%
1 ene 2001 año
67.137 bn
+278.275 millones
0.42%
1 ene 2002 año
68.512 bn
+1.375 bn
2.05%
1 ene 2003 año
70.306 bn
+1.794 bn
2.62%
1 ene 2004 año
72.556 bn
+2.25 bn
3.2%
1 ene 2005 año
75.332 bn
+2.776 bn
3.83%
1 ene 2006 año
77.72 bn
+2.388 bn
3.17%
1 ene 2007 año
81.45 bn
+3.73 bn
4.8%
1 ene 2008 año
85.604 bn
+4.154 bn
5.1%
1 ene 2009 año
90.569 bn
+4.965 bn
5.8%
1 ene 2010 año
95.127 bn
+4.558 bn
5.03%
1 ene 2011 año
98.444 bn
+3.317 bn
3.49%
1 ene 2012 año
102.842 bn
+4.398 bn
4.47%
1 ene 2013 año
107.822 bn
+4.98 bn
4.84%
1 ene 2014 año
113.213 bn
+5.391 bn
5.0%
1 ene 2015 año
120.006 bn
+6.793 bn
6.0%
1 ene 2016 año
127.807 bn
+7.801 bn
6.5%

Ranking de los países por los datos estadísticos actuales