33
/es/
AIzaSyB4mHJ5NPEv-XzF7P6NDYXjlkCWaeKw5bc
November 30, 2025
272904
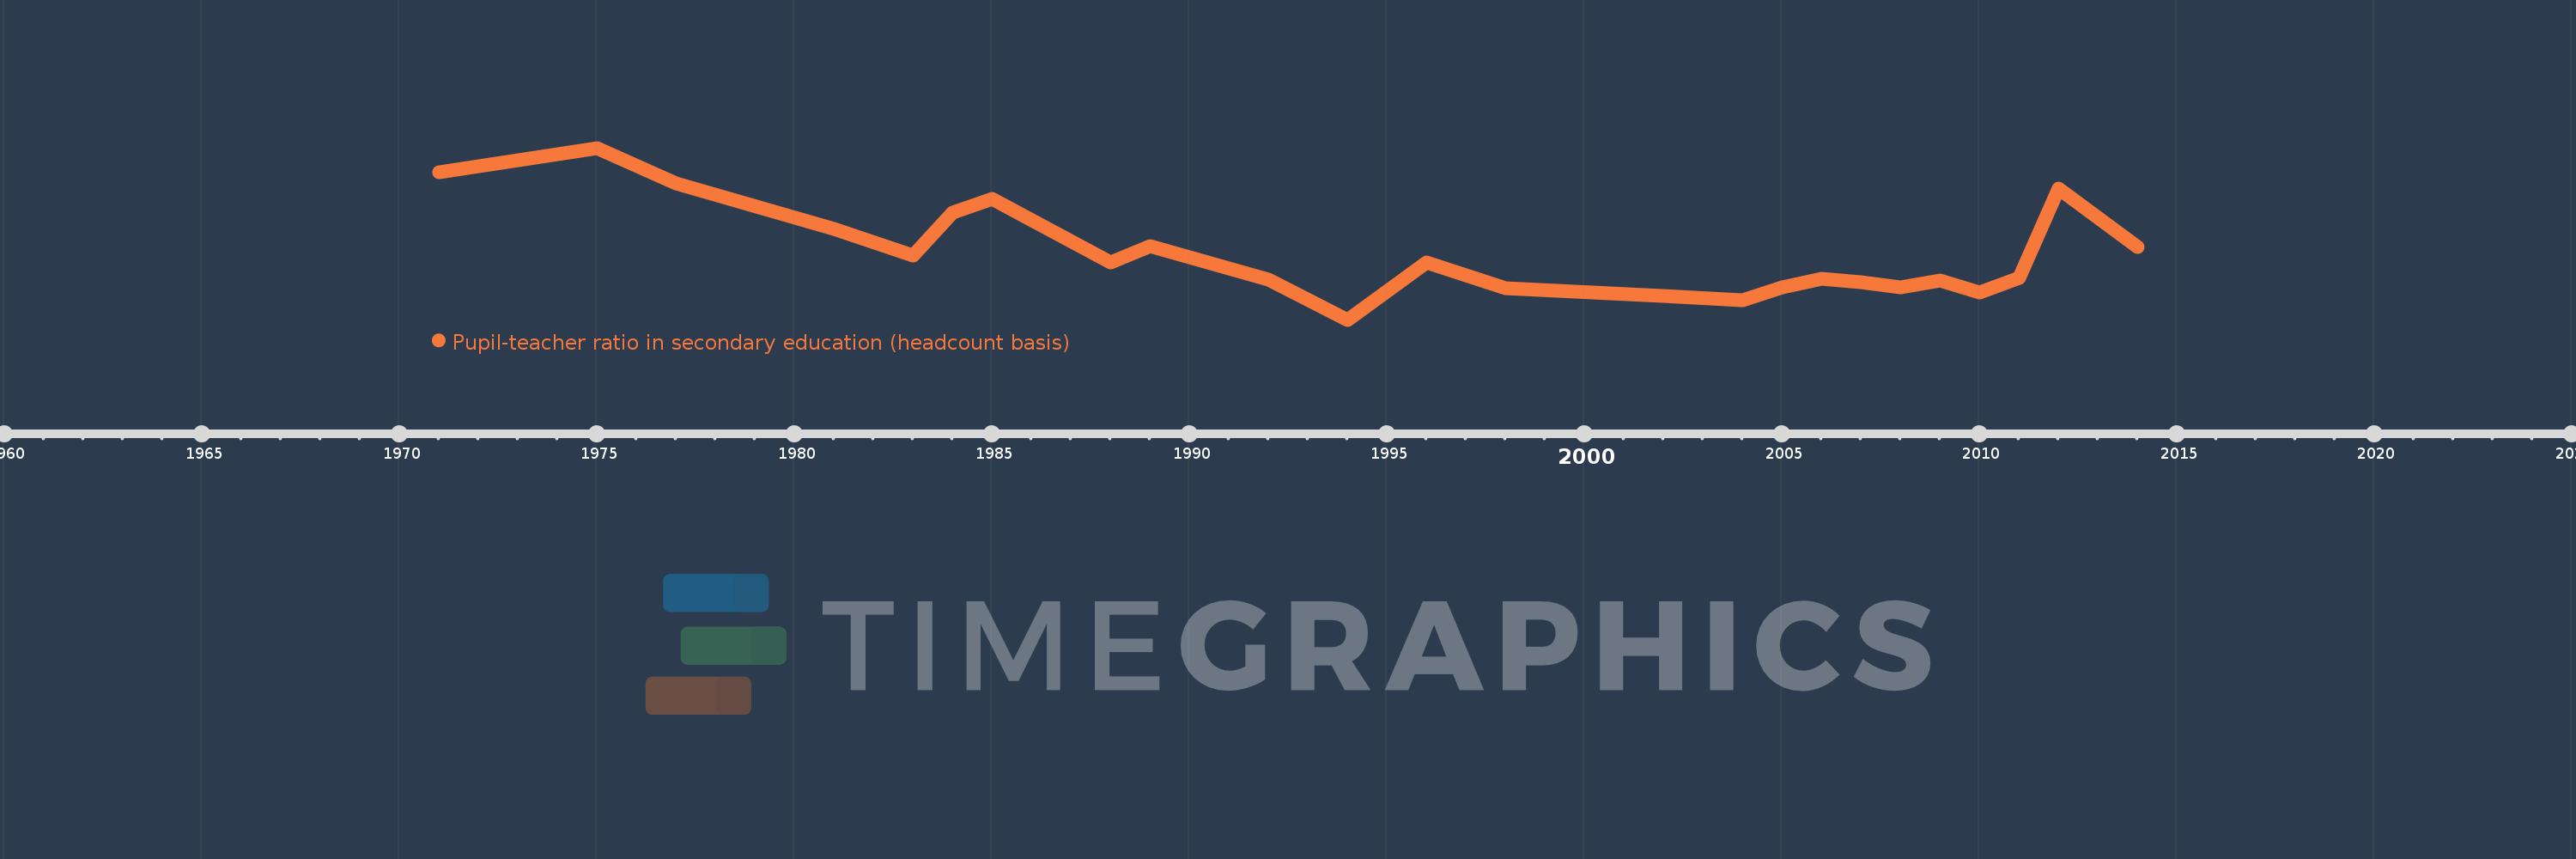
Uganda
UGA
true
2
1
Pupil-teacher ratio in secondary education (headcount basis)
2014,2012,2011,2010,2009,2008,2007,2006,2005,2004,2002,1998,1996,1994,1992,1989,1988,1985,1984,1983,1981,1977,1975,1971