33
/es/
AIzaSyB4mHJ5NPEv-XzF7P6NDYXjlkCWaeKw5bc
November 30, 2025
111566
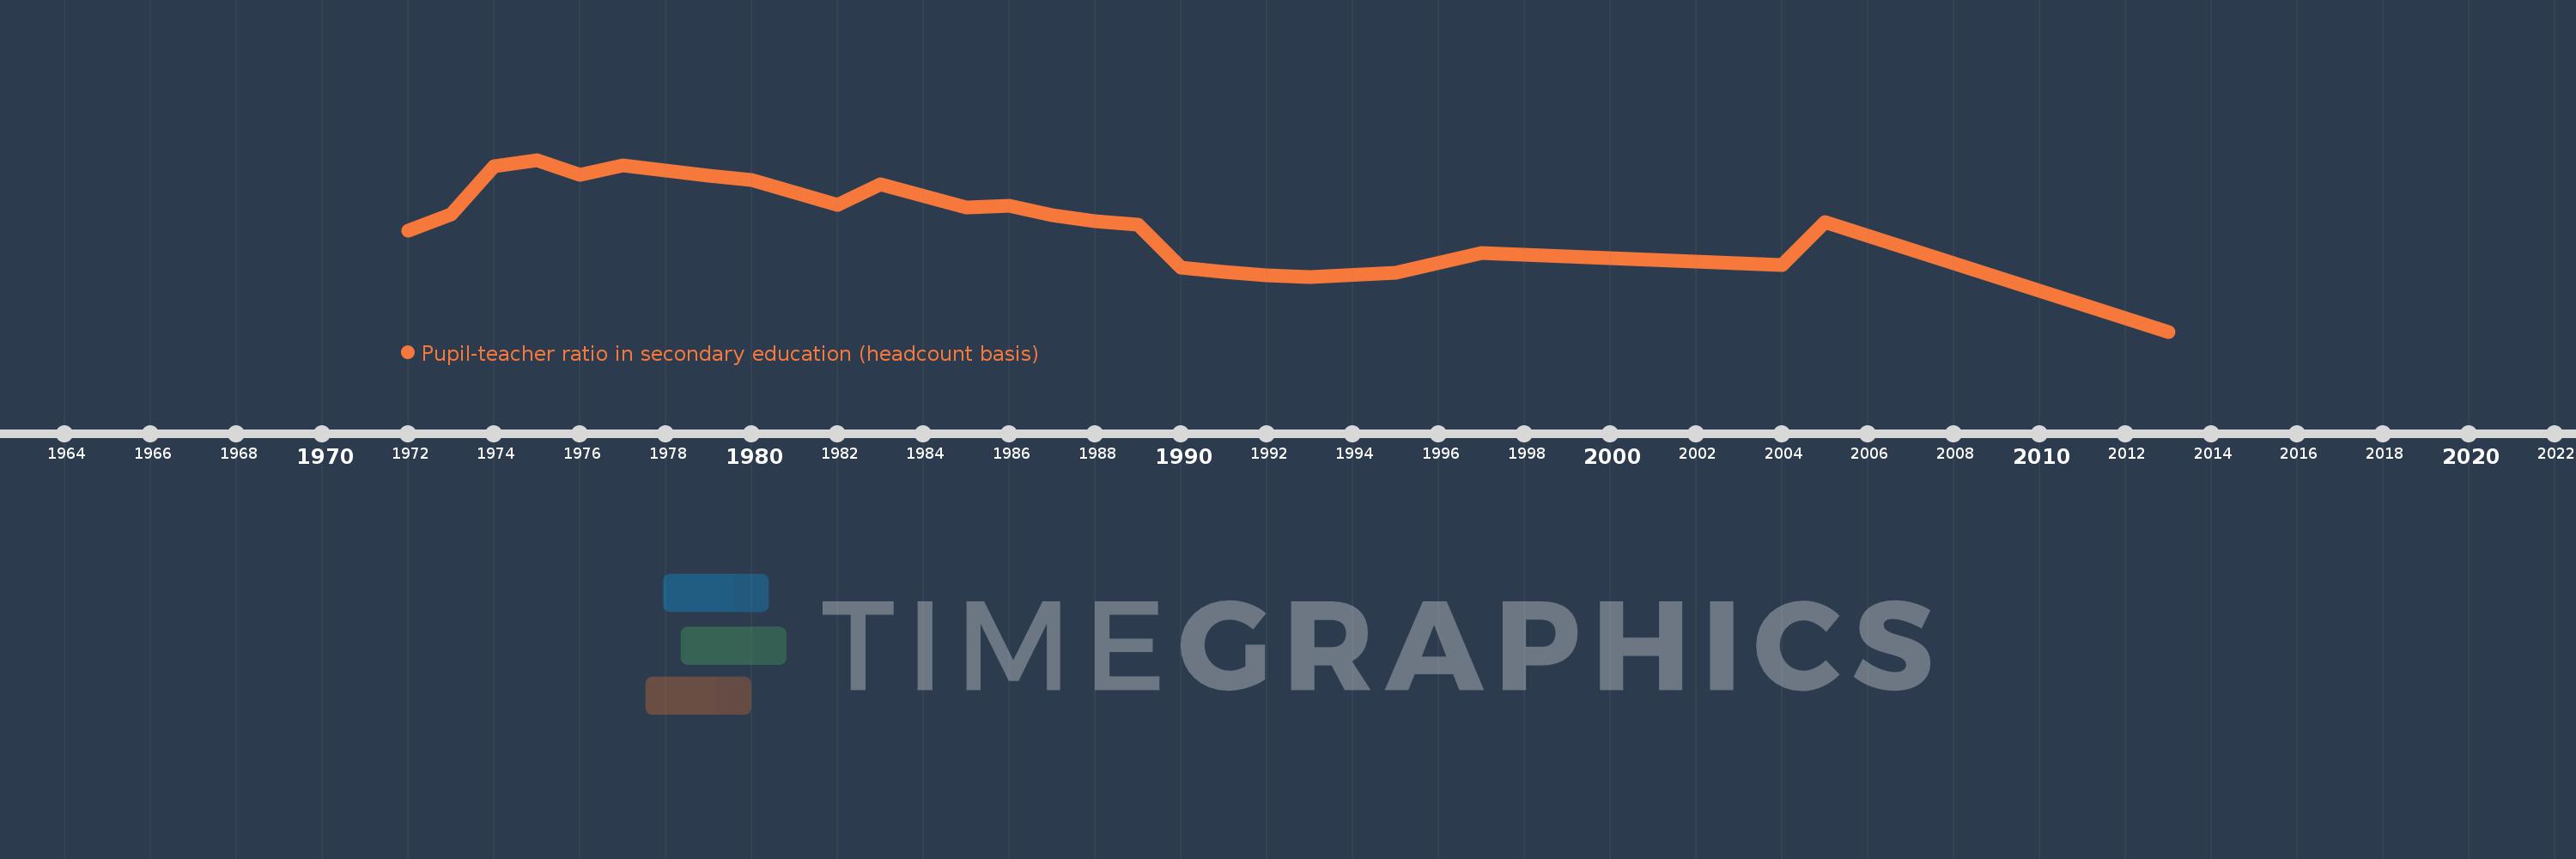
Congo, Rep.
COG
true
2
1
Pupil-teacher ratio in secondary education (headcount basis)
2013,2005,2004,1997,1995,1993,1992,1991,1990,1989,1988,1987,1986,1985,1983,1982,1980,1979,1977,1976,1975,1974,1973,1972