33
/es/
AIzaSyB4mHJ5NPEv-XzF7P6NDYXjlkCWaeKw5bc
November 1, 2025
203551
Mozambique
MOZ
true
2
1
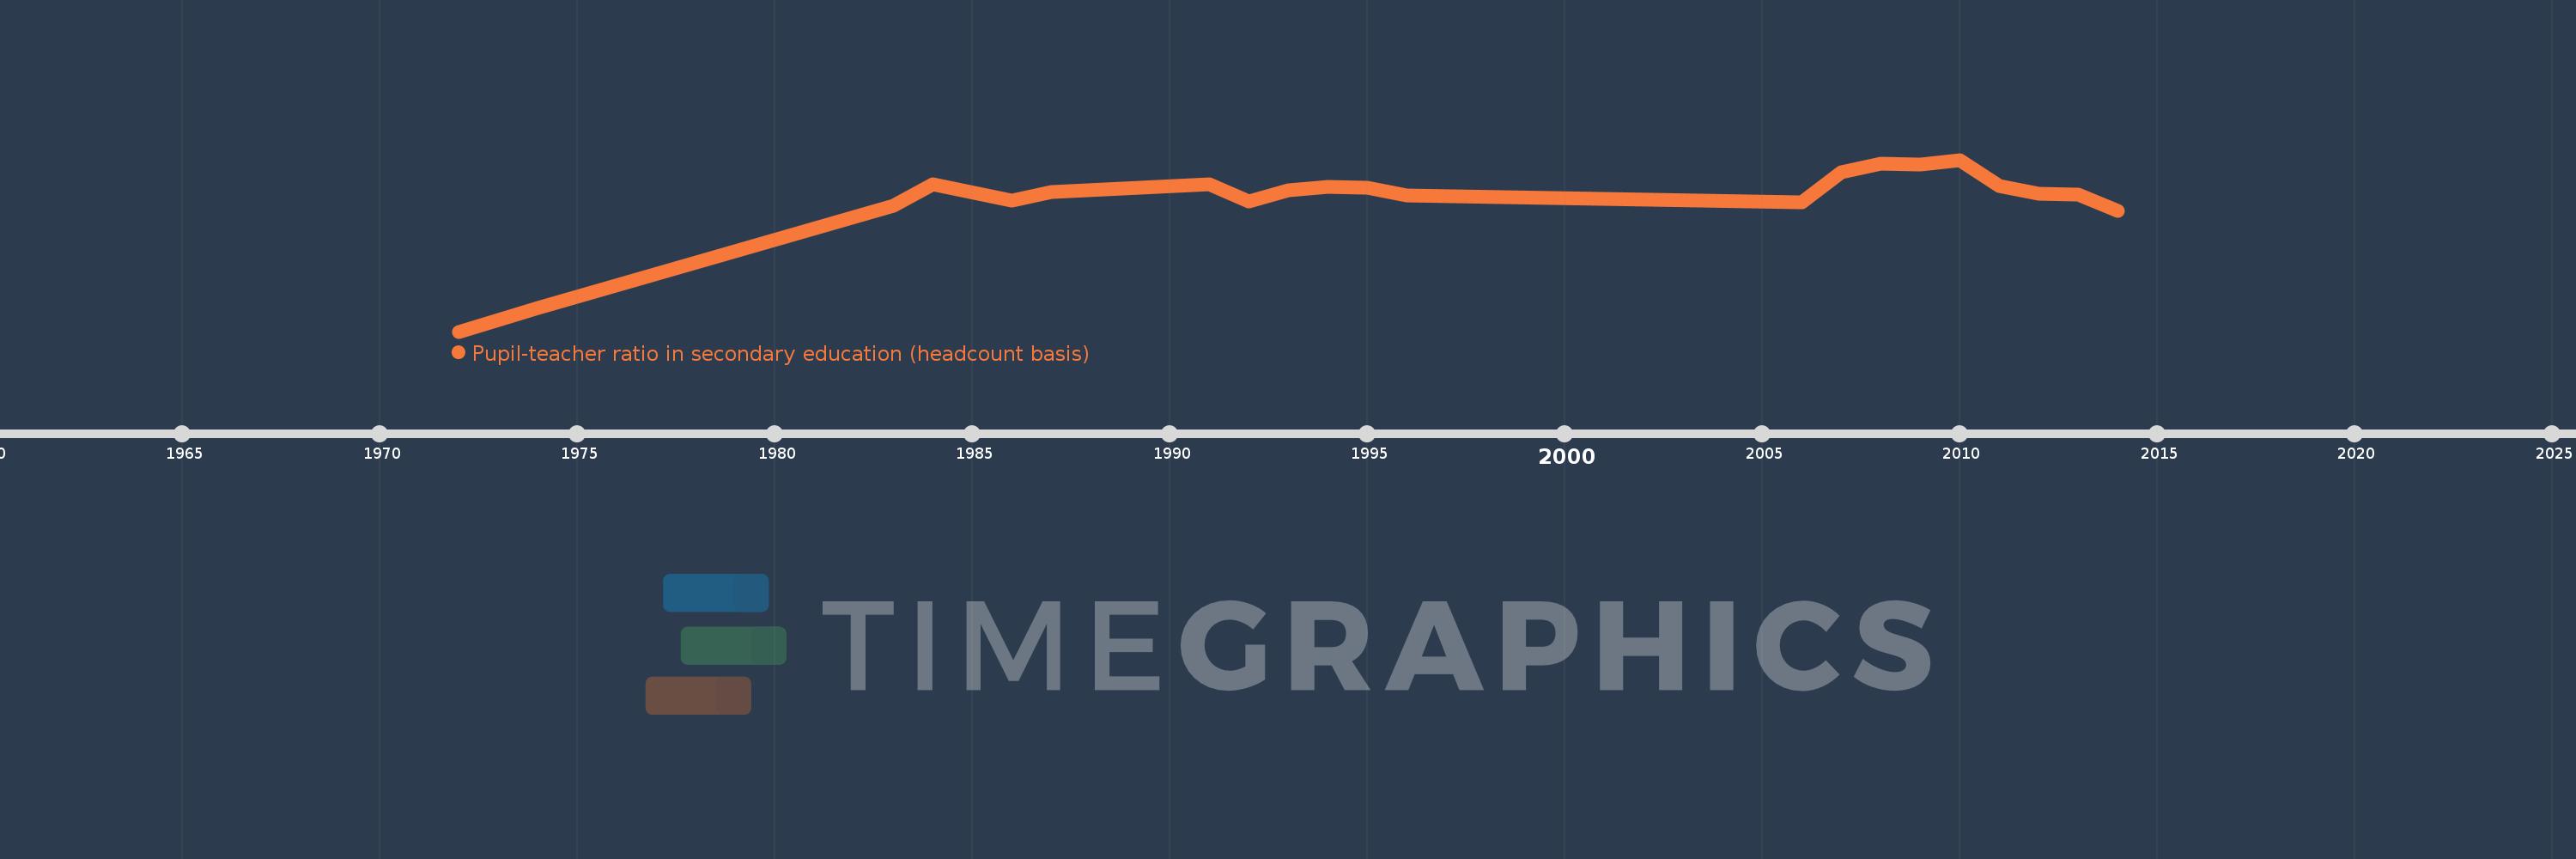
Pupil-teacher ratio in secondary education (headcount basis)
2014,2013,2012,2011,2010,2009,2008,2007,2006,1996,1995,1994,1993,1992,1991,1987,1986,1984,1983,1974,1973,1972