29
/es/
es
AIzaSyAYiBZKx7MnpbEhh9jyipgxe19OcubqV5w
April 1, 2024
270499
Turkmenistan
TKM
true
2
1
GDP (current LCU)
2016,2015,2014,2013,2012,2011,2010,2009,2008,2007,2006,2005,2004,2003,2002,2001,2000,1999,1998,1997,1996,1995,1994,1993,1992,1991,1990,1989,1988
Download
Estadísticas Globales de la Biblioteca →Turkmenistan →

GDP (current LCU)

Estas estadísticas en otros países:
AfghanistanAlbaniaAlgeriaAndorraAngolaAntigua and BarbudaArgentinaArmeniaArubaAustraliaAustriaAzerbaijanBahamas, TheBahrainBangladeshBarbadosBelarusBelgiumBelizeBeninBermudaBhutanBoliviaBosnia and HerzegovinaBotswanaBrazilBrunei DarussalamBulgariaBurkina FasoBurundiCabo VerdeCambodiaCameroonCanadaCayman IslandsCentral African RepublicChadChannel IslandsChileChinaColombiaComorosCongo, Dem. Rep.Congo, Rep.Costa RicaCote d'IvoireCroatiaCubaCyprusCzech RepublicDenmarkDjiboutiDominicaDominican RepublicEcuadorEgypt, Arab Rep.El SalvadorEquatorial GuineaEritreaEstoniaEthiopiaFaroe IslandsFijiFinlandFranceFrench PolynesiaGabonGambia, TheGeorgiaGermanyGhanaGreeceGreenlandGrenadaGuatemalaGuineaGuinea-BissauGuyanaHaitiHondurasHong Kong SAR, ChinaHungaryIcelandIndiaIndonesiaIran, Islamic Rep.IraqIrelandIsle of ManIsraelItalyJamaicaJapanJordanKazakhstanKenyaKiribatiKorea, Rep.KosovoKuwaitKyrgyz RepublicLao PDRLatviaLebanonLesothoLiberiaLibyaLiechtensteinLithuaniaLuxembourgMacao SAR, ChinaMacedonia, FYRMadagascarMalawiMalaysiaMaldivesMaliMaltaMarshall IslandsMauritaniaMauritiusMexicoMicronesia, Fed. Sts.MoldovaMonacoMongoliaMontenegroMoroccoMozambiqueMyanmarNamibiaNauruNepalNetherlandsNew CaledoniaNew ZealandNicaraguaNigerNigeriaNorwayOmanPakistanPalauPanamaPapua New GuineaParaguayPeruPhilippinesPolandPortugalPuerto RicoQatarRomaniaRussian FederationRwandaSamoaSan MarinoSao Tome and PrincipeSaudi ArabiaSenegalSerbiaSeychellesSierra LeoneSingaporeSint Maarten (Dutch part)Slovak RepublicSloveniaSolomon IslandsSomaliaSouth AfricaSouth SudanSpainSri LankaSt. Kitts and NevisSt. LuciaSt. Vincent and the GrenadinesSudanSurinameSwazilandSwedenSwitzerlandSyrian Arab RepublicTajikistanTanzaniaThailandTimor-LesteTogoTongaTrinidad and TobagoTunisiaTurkeyTurkmenistanTuvaluUgandaUkraineUnited Arab EmiratesUnited KingdomUnited StatesUruguayUzbekistanVanuatuVenezuela, RBVietnamVirgin Islands (U.S.)West Bank and GazaYemen, Rep.ZambiaZimbabwe
línea de tiempo (timeline):
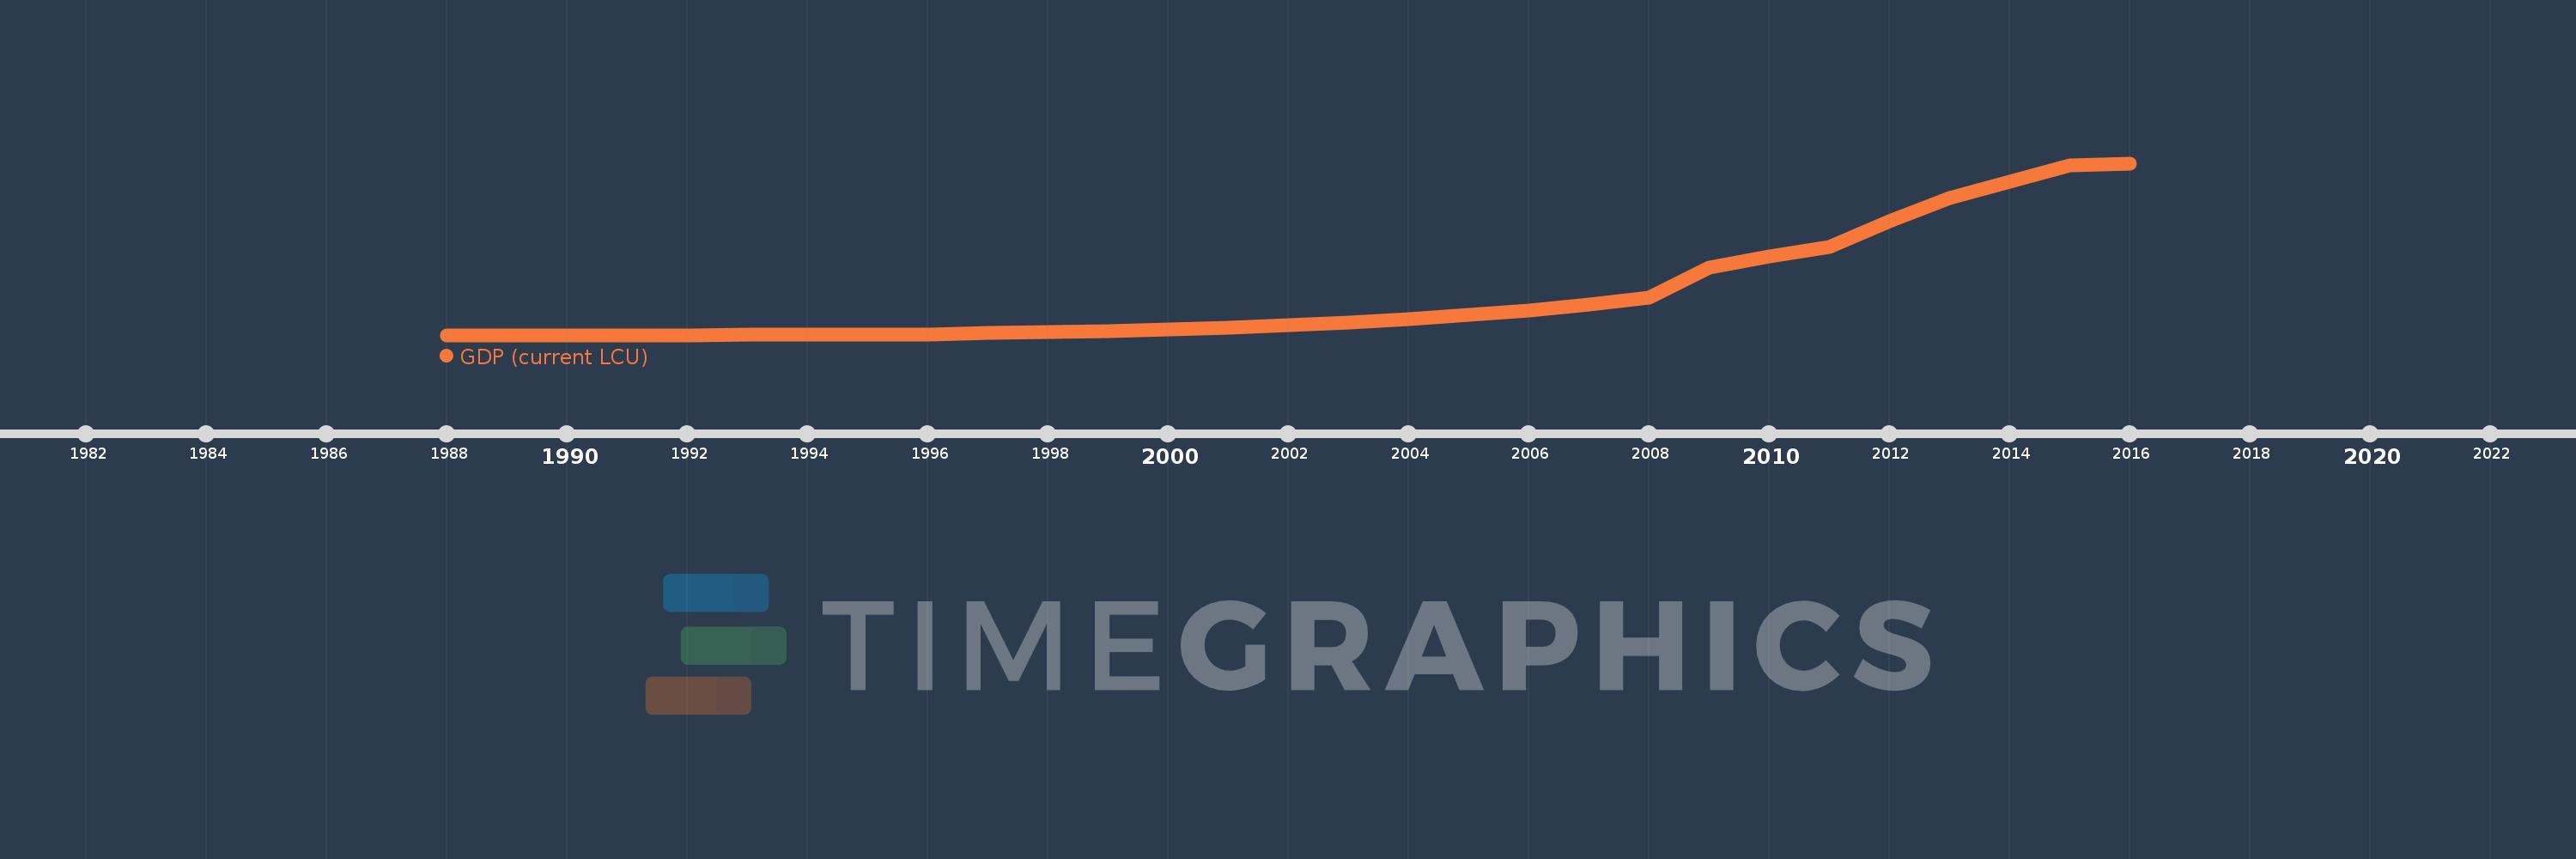
En esta escala de tiempo se presenta un gráfico de 1988 y 2016 de Turkmenistan. Los datos de 1987 están ausentes. El número de observaciones reales por fecha: 29.
Fuente (nombre):
Indicadores del desarrollo mundial
Fuente (organización):
World Bank national accounts data, and OECD National Accounts data files.
Categorías:
Economy & Growth
Se ha actualizado:
23 abr 2017 año
Los indicadores de los cambios de valor en los últimos años
En promedio:
29.04 bn
Mínimo:
2.5 mil
1 ene 1988 año
Máximo:
125.491 bn
1 ene 2016 año
A la fecha de observación
Valor
Cambio absoluto
El cambio con respecto al valor anterior
1 ene 1988 año
2.5 mil
+2.5 mil
0.0%
1 ene 1989 año
2.7 mil
+200.0
8.0%
1 ene 1990 año
2.8 mil
+100.0
3.7%
1 ene 1991 año
3.0 mil
+200.0
7.14%
1 ene 1992 año
5.9 mil
+2.9 mil
96.67%
1 ene 1993 año
160.0 mil
+154.1 mil
2.61 mil%
1 ene 1994 año
2.004 millones
+1.844 millones
1.15 mil%
1 ene 1995 año
17.44 millones
+15.436 millones
770.26%
1 ene 1996 año
130.4 millones
+112.96 millones
647.71%
1 ene 1997 año
1.55 bn
+1.42 bn
1.09 mil%
1 ene 1998 año
2.222 bn
+671.42 millones
43.31%
1 ene 1999 año
2.799 bn
+577.24 millones
25.98%
1 ene 2000 año
4.011 bn
+1.212 bn
43.31%
1 ene 2001 año
5.223 bn
+1.212 bn
30.21%
1 ene 2002 año
7.211 bn
+1.988 bn
38.06%
1 ene 2003 año
9.048 bn
+1.837 bn
25.47%
1 ene 2004 año
11.881 bn
+2.833 bn
31.31%
1 ene 2005 año
14.764 bn
+2.883 bn
24.27%
1 ene 2006 año
17.862 bn
+3.098 bn
20.98%
1 ene 2007 año
22.251 bn
+4.389 bn
24.57%
1 ene 2008 año
27.0 bn
+4.749 bn
21.34%
1 ene 2009 año
49.47 bn
+22.47 bn
83.22%
1 ene 2010 año
57.611 bn
+8.141 bn
16.46%
1 ene 2011 año
64.362 bn
+6.751 bn
11.72%
1 ene 2012 año
83.315 bn
+18.953 bn
29.45%
1 ene 2013 año
100.218 bn
+16.903 bn
20.29%
1 ene 2014 año
111.713 bn
+11.495 bn
11.47%
1 ene 2015 año
124.014 bn
+12.301 bn
11.01%
1 ene 2016 año
125.491 bn
+1.477 bn
1.19%
Ranking de los países por los datos estadísticos actuales

Comentarios:

Enviar
PremiumAbout & FeedbackAcuerdoPrivacidad
logo
© 2022 Selected Technologies LLC – Morgan Hill, California