33
/es/
AIzaSyAYiBZKx7MnpbEhh9jyipgxe19OcubqV5w
August 1, 2025
149128
Haiti
HTI
true
2
1
GDP (current LCU)
2016,2015,2014,2013,2012,2011,2010,2009,2008,2007,2006,2005,2004,2003,2002,2001,2000,1999,1998,1997,1996,1995,1994,1993,1992
Download
Estadísticas Globales de la Biblioteca →Haiti →

GDP (current LCU)

Estas estadísticas en otros países:

AfghanistanAlbaniaAlgeriaAndorraAngolaAntigua and BarbudaArgentinaArmeniaArubaAustraliaAustriaAzerbaijanBahamas, TheBahrainBangladeshBarbadosBelarusBelgiumBelizeBeninBermudaBhutanBoliviaBosnia and HerzegovinaBotswanaBrazilBrunei DarussalamBulgariaBurkina FasoBurundiCabo VerdeCambodiaCameroonCanadaCayman IslandsCentral African RepublicChadChannel IslandsChileChinaColombiaComorosCongo, Dem. Rep.Congo, Rep.Costa RicaCote d'IvoireCroatiaCubaCyprusCzech RepublicDenmarkDjiboutiDominicaDominican RepublicEcuadorEgypt, Arab Rep.El SalvadorEquatorial GuineaEritreaEstoniaEthiopiaFaroe IslandsFijiFinlandFranceFrench PolynesiaGabonGambia, TheGeorgiaGermanyGhanaGreeceGreenlandGrenadaGuatemalaGuineaGuinea-BissauGuyanaHaitiHondurasHong Kong SAR, ChinaHungaryIcelandIndiaIndonesiaIran, Islamic Rep.IraqIrelandIsle of ManIsraelItalyJamaicaJapanJordanKazakhstanKenyaKiribatiKorea, Rep.KosovoKuwaitKyrgyz RepublicLao PDRLatviaLebanonLesothoLiberiaLibyaLiechtensteinLithuaniaLuxembourgMacao SAR, ChinaMacedonia, FYRMadagascarMalawiMalaysiaMaldivesMaliMaltaMarshall IslandsMauritaniaMauritiusMexicoMicronesia, Fed. Sts.MoldovaMonacoMongoliaMontenegroMoroccoMozambiqueMyanmarNamibiaNauruNepalNetherlandsNew CaledoniaNew ZealandNicaraguaNigerNigeriaNorwayOmanPakistanPalauPanamaPapua New GuineaParaguayPeruPhilippinesPolandPortugalPuerto RicoQatarRomaniaRussian FederationRwandaSamoaSan MarinoSao Tome and PrincipeSaudi ArabiaSenegalSerbiaSeychellesSierra LeoneSingaporeSint Maarten (Dutch part)Slovak RepublicSloveniaSolomon IslandsSomaliaSouth AfricaSouth SudanSpainSri LankaSt. Kitts and NevisSt. LuciaSt. Vincent and the GrenadinesSudanSurinameSwazilandSwedenSwitzerlandSyrian Arab RepublicTajikistanTanzaniaThailandTimor-LesteTogoTongaTrinidad and TobagoTunisiaTurkeyTurkmenistanTuvaluUgandaUkraineUnited Arab EmiratesUnited KingdomUnited StatesUruguayUzbekistanVanuatuVenezuela, RBVietnamVirgin Islands (U.S.)West Bank and GazaYemen, Rep.ZambiaZimbabwe

línea de tiempo (timeline):

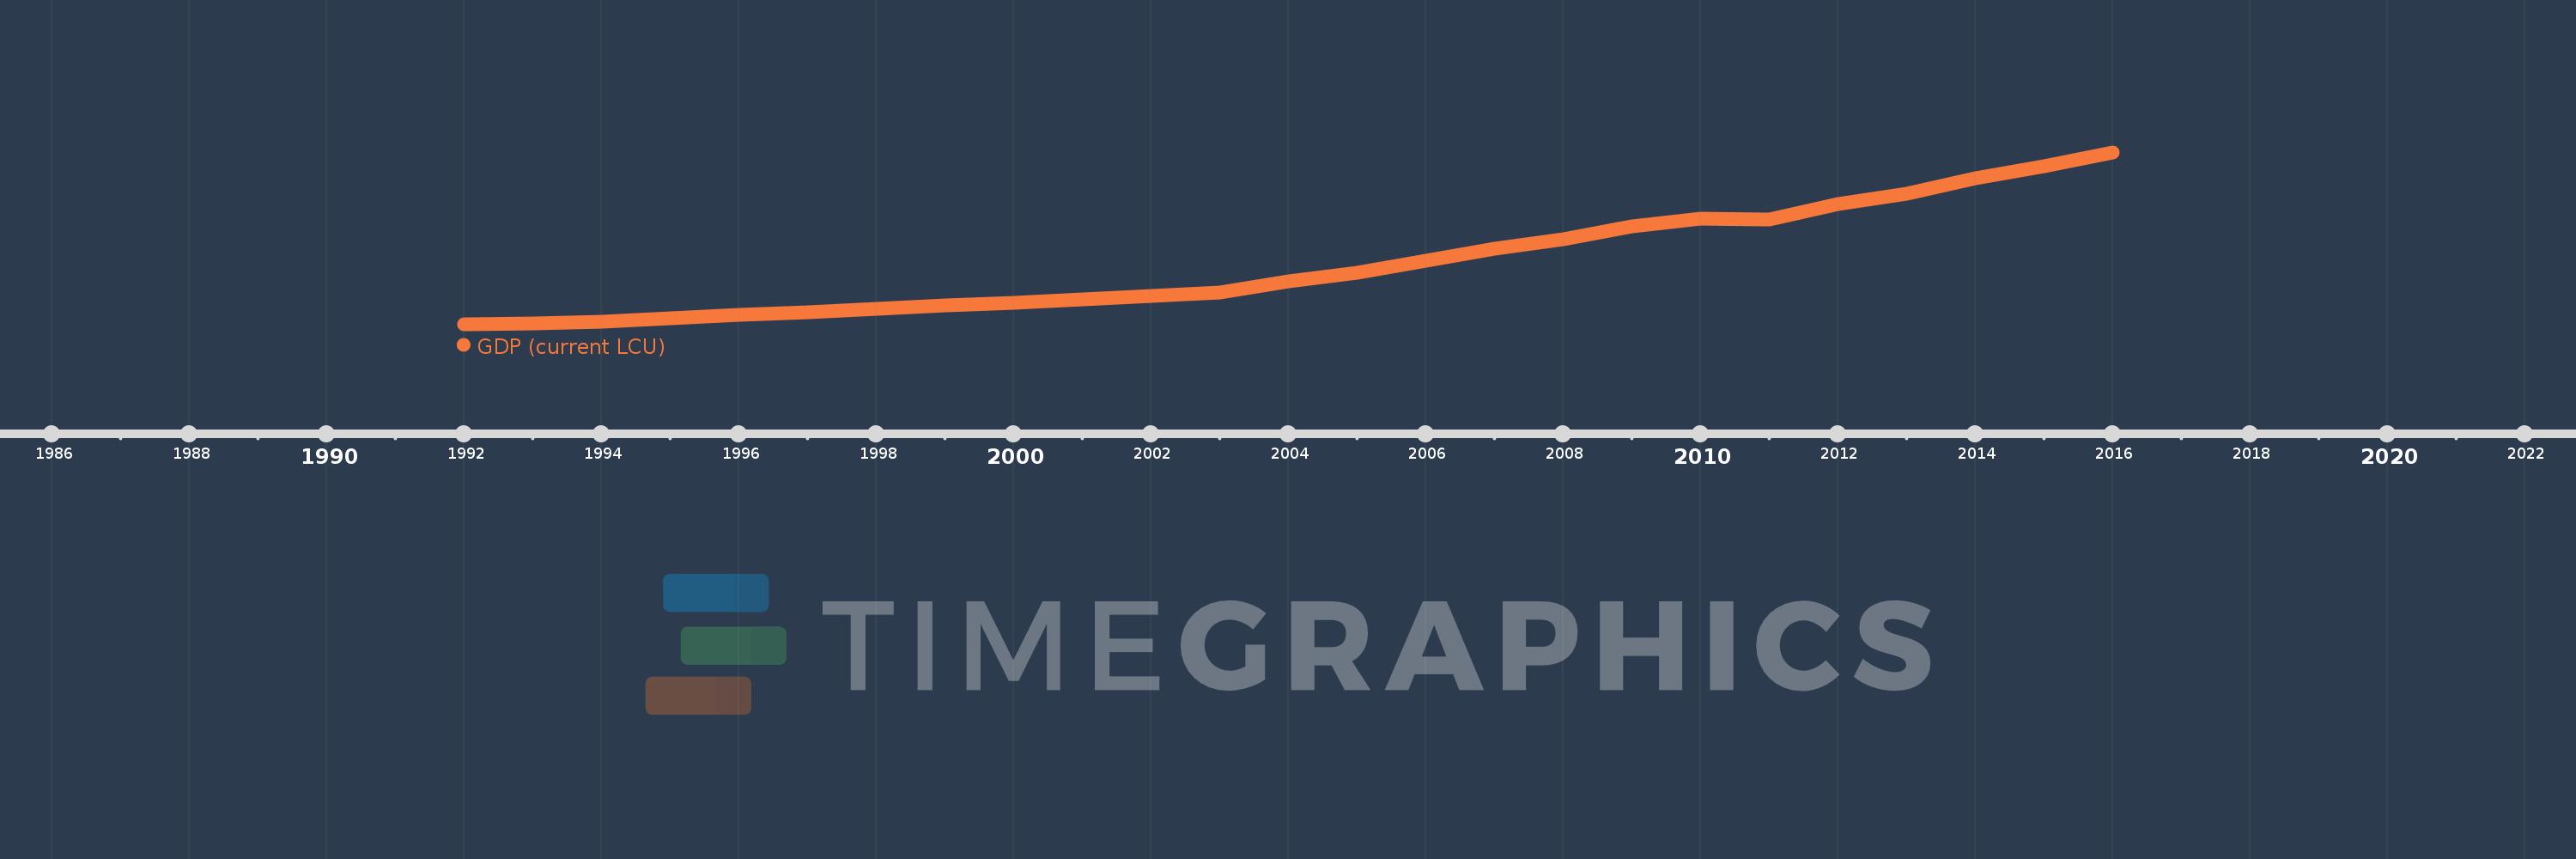
En esta escala de tiempo se presenta un gráfico de 1992 y 2016 de Haiti. Los datos de 1991 están ausentes. El número de observaciones reales por fecha: 25.

Fuente (nombre):

Indicadores del desarrollo mundial

Fuente (organización):

World Bank national accounts data, and OECD National Accounts data files.

Categorías:

Economy & Growth

Se ha actualizado:

23 abr 2017 año

Los indicadores de los cambios de valor en los últimos años

En promedio:
162.762 bn
Mínimo:
18.077 bn
1 ene 1992 año
Máximo:
425.619 bn
1 ene 2016 año
A la fecha de observación
Valor
Cambio absoluto
El cambio con respecto al valor anterior
1 ene 1992 año
18.077 bn
+18.077 bn
0.0%
1 ene 1993 año
20.696 bn
+2.619 bn
14.49%
1 ene 1994 año
23.162 bn
+2.466 bn
11.92%
1 ene 1995 año
31.959 bn
+8.797 bn
37.98%
1 ene 1996 año
40.729 bn
+8.77 bn
27.44%
1 ene 1997 año
46.647 bn
+5.918 bn
14.53%
1 ene 1998 año
54.006 bn
+7.359 bn
15.78%
1 ene 1999 año
62.997 bn
+8.991 bn
16.65%
1 ene 2000 año
69.254 bn
+6.257 bn
9.93%
1 ene 2001 año
77.58 bn
+8.326 bn
12.02%
1 ene 2002 año
85.7 bn
+8.12 bn
10.47%
1 ene 2003 año
94.028 bn
+8.328 bn
9.72%
1 ene 2004 año
119.758 bn
+25.73 bn
27.36%
1 ene 2005 año
140.387 bn
+20.629 bn
17.23%
1 ene 2006 año
168.035 bn
+27.648 bn
19.69%
1 ene 2007 año
197.138 bn
+29.103 bn
17.32%
1 ene 2008 año
220.11 bn
+22.972 bn
11.65%
1 ene 2009 año
250.59 bn
+30.48 bn
13.85%
1 ene 2010 año
267.88 bn
+17.29 bn
6.9%
1 ene 2011 año
266.952 bn
-928.0 millones
-0.35%
1 ene 2012 año
302.854 bn
+35.902 bn
13.45%
1 ene 2013 año
328.061 bn
+25.207 bn
8.32%
1 ene 2014 año
364.517 bn
+36.456 bn
11.11%
1 ene 2015 año
392.315 bn
+27.798 bn
7.63%
1 ene 2016 año
425.619 bn
+33.304 bn
8.49%

Ranking de los países por los datos estadísticos actuales