30
/es/
AIzaSyAYiBZKx7MnpbEhh9jyipgxe19OcubqV5w
April 1, 2024
179939
Libya
LBY
true
2
1
GDP (current LCU)
2012,2011,2010,2009,2008,2007,2006,2005,2004,2003,2002,2001,2000,1999,1998,1997,1996,1995,1994,1993,1992,1991
Download
Estadísticas Globales de la Biblioteca →Libya →

GDP (current LCU)

Estas estadísticas en otros países:

AfghanistanAlbaniaAlgeriaAndorraAngolaAntigua and BarbudaArgentinaArmeniaArubaAustraliaAustriaAzerbaijanBahamas, TheBahrainBangladeshBarbadosBelarusBelgiumBelizeBeninBermudaBhutanBoliviaBosnia and HerzegovinaBotswanaBrazilBrunei DarussalamBulgariaBurkina FasoBurundiCabo VerdeCambodiaCameroonCanadaCayman IslandsCentral African RepublicChadChannel IslandsChileChinaColombiaComorosCongo, Dem. Rep.Congo, Rep.Costa RicaCote d'IvoireCroatiaCubaCyprusCzech RepublicDenmarkDjiboutiDominicaDominican RepublicEcuadorEgypt, Arab Rep.El SalvadorEquatorial GuineaEritreaEstoniaEthiopiaFaroe IslandsFijiFinlandFranceFrench PolynesiaGabonGambia, TheGeorgiaGermanyGhanaGreeceGreenlandGrenadaGuatemalaGuineaGuinea-BissauGuyanaHaitiHondurasHong Kong SAR, ChinaHungaryIcelandIndiaIndonesiaIran, Islamic Rep.IraqIrelandIsle of ManIsraelItalyJamaicaJapanJordanKazakhstanKenyaKiribatiKorea, Rep.KosovoKuwaitKyrgyz RepublicLao PDRLatviaLebanonLesothoLiberiaLibyaLiechtensteinLithuaniaLuxembourgMacao SAR, ChinaMacedonia, FYRMadagascarMalawiMalaysiaMaldivesMaliMaltaMarshall IslandsMauritaniaMauritiusMexicoMicronesia, Fed. Sts.MoldovaMonacoMongoliaMontenegroMoroccoMozambiqueMyanmarNamibiaNauruNepalNetherlandsNew CaledoniaNew ZealandNicaraguaNigerNigeriaNorwayOmanPakistanPalauPanamaPapua New GuineaParaguayPeruPhilippinesPolandPortugalPuerto RicoQatarRomaniaRussian FederationRwandaSamoaSan MarinoSao Tome and PrincipeSaudi ArabiaSenegalSerbiaSeychellesSierra LeoneSingaporeSint Maarten (Dutch part)Slovak RepublicSloveniaSolomon IslandsSomaliaSouth AfricaSouth SudanSpainSri LankaSt. Kitts and NevisSt. LuciaSt. Vincent and the GrenadinesSudanSurinameSwazilandSwedenSwitzerlandSyrian Arab RepublicTajikistanTanzaniaThailandTimor-LesteTogoTongaTrinidad and TobagoTunisiaTurkeyTurkmenistanTuvaluUgandaUkraineUnited Arab EmiratesUnited KingdomUnited StatesUruguayUzbekistanVanuatuVenezuela, RBVietnamVirgin Islands (U.S.)West Bank and GazaYemen, Rep.ZambiaZimbabwe

línea de tiempo (timeline):

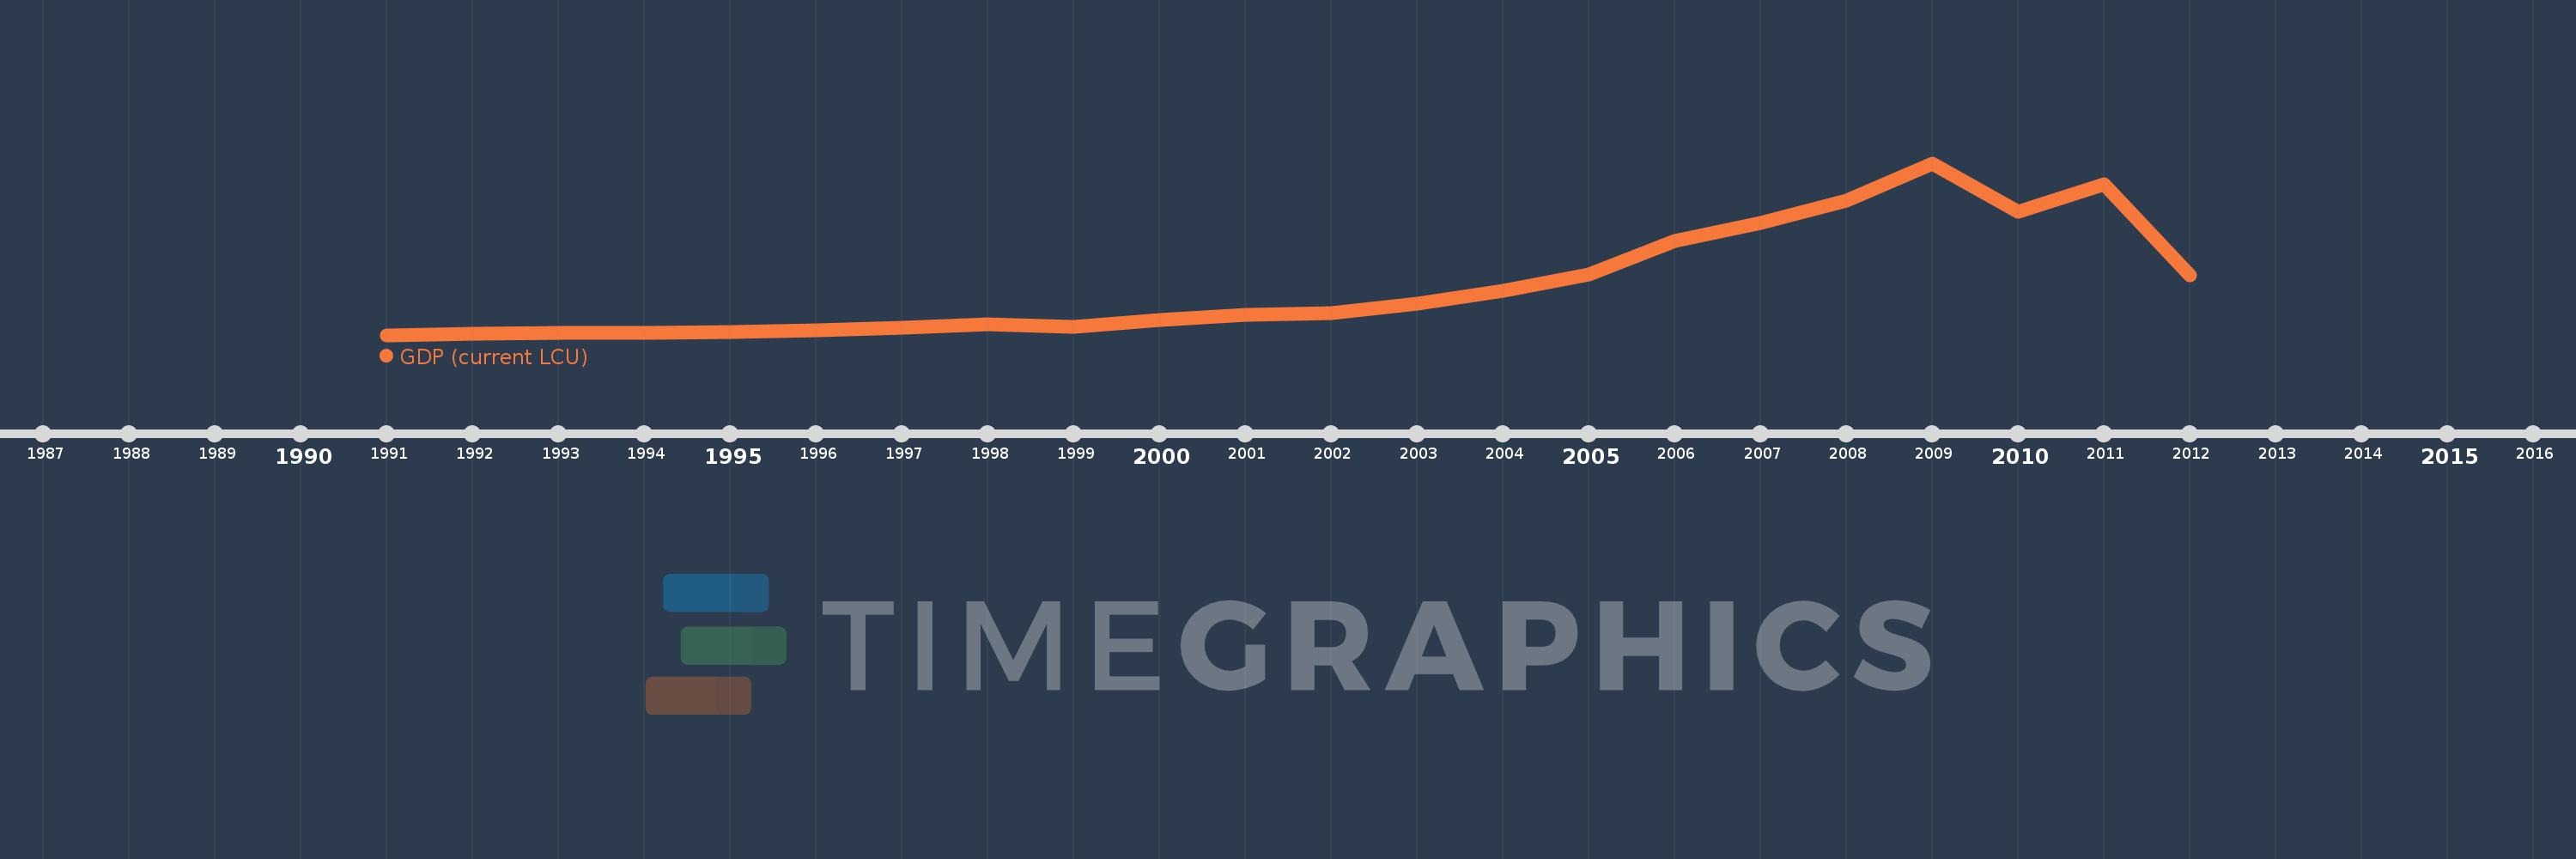
En esta escala de tiempo se presenta un gráfico de 1991 y 2012 de Libya. Los datos de 1990 están ausentes. El número de observaciones reales por fecha: 22.

Fuente (nombre):

Indicadores del desarrollo mundial

Fuente (organización):

World Bank national accounts data, and OECD National Accounts data files.

Categorías:

Economy & Growth

Se ha actualizado:

23 abr 2017 año

Los indicadores de los cambios de valor en los últimos años

En promedio:
36.254 bn
Mínimo:
8.185 bn
1 ene 1991 año
Máximo:
106.625 bn
1 ene 2009 año
A la fecha de observación
Valor
Cambio absoluto
El cambio con respecto al valor anterior
1 ene 1991 año
8.185 bn
+8.185 bn
0.0%
1 ene 1992 año
8.981 bn
+796.0 millones
9.73%
1 ene 1993 año
9.541 bn
+560.0 millones
6.24%
1 ene 1994 año
9.332 bn
-209.0 millones
-2.19%
1 ene 1995 año
9.967 bn
+635.0 millones
6.8%
1 ene 1996 año
10.68 bn
+713.0 millones
7.15%
1 ene 1997 año
12.18 bn
+1.5 bn
14.04%
1 ene 1998 año
14.149 bn
+1.969 bn
16.17%
1 ene 1999 año
12.742 bn
-1.407 bn
-9.94%
1 ene 2000 año
16.686 bn
+3.944 bn
30.95%
1 ene 2001 año
19.602 bn
+2.916 bn
17.48%
1 ene 2002 año
20.64 bn
+1.038 bn
5.3%
1 ene 2003 año
26.012 bn
+5.372 bn
26.03%
1 ene 2004 año
33.62 bn
+7.608 bn
29.25%
1 ene 2005 año
43.059 bn
+9.439 bn
28.08%
1 ene 2006 año
61.932 bn
+18.873 bn
43.83%
1 ene 2007 año
72.198 bn
+10.266 bn
16.58%
1 ene 2008 año
85.246 bn
+13.048 bn
18.07%
1 ene 2009 año
106.625 bn
+21.379 bn
25.08%
1 ene 2010 año
79.006 bn
-27.619 bn
-25.9%
1 ene 2011 año
94.723 bn
+15.717 bn
19.89%
1 ene 2012 año
42.479 bn
-52.244 bn
-55.15%

Ranking de los países por los datos estadísticos actuales