29
/es/
es
AIzaSyAYiBZKx7MnpbEhh9jyipgxe19OcubqV5w
April 1, 2024
266142
Tonga
TON
true
2
1
Percentage of repeaters in primary education, all grades, both sexes (%)
2014,2013,2007,2006,2002,2000,1999,1994,1992,1991,1987,1986,1985,1984,1983,1982,1980,1979,1978
Download
Estadísticas Globales de la Biblioteca →Tonga →

Percentage of repeaters in primary education, all grades, both sexes (%)

Estas estadísticas en otros países:
AfghanistanAlbaniaAlgeriaAndorraAngolaAntigua and BarbudaArab WorldArgentinaArmeniaArubaAustriaAzerbaijanBahamas, TheBahrainBangladeshBelarusBelgiumBelizeBeninBermudaBhutanBoliviaBosnia and HerzegovinaBotswanaBrazilBritish Virgin IslandsBrunei DarussalamBulgariaBurkina FasoBurundiCabo VerdeCambodiaCameroonCanadaCaribbean small statesCayman IslandsCentral African RepublicCentral Europe and the BalticsChadChileChinaColombiaComorosCongo, Dem. Rep.Congo, Rep.Costa RicaCote d'IvoireCroatiaCubaCyprusCzech RepublicDenmarkDjiboutiDominicaDominican RepublicEarly-demographic dividendEast Asia & PacificEast Asia & Pacific (excluding high income)East Asia & Pacific (IDA & IBRD countries)EcuadorEgypt, Arab Rep.El SalvadorEquatorial GuineaEritreaEstoniaEthiopiaEuro areaEurope & Central AsiaEurope & Central Asia (excluding high income)Europe & Central Asia (IDA & IBRD countries)European UnionFijiFinlandFragile and conflict affected situationsFranceGabonGambia, TheGeorgiaGermanyGhanaGreeceGrenadaGuatemalaGuineaGuinea-BissauGuyanaHaitiHeavily indebted poor countries (HIPC)High incomeHondurasHong Kong SAR, ChinaHungaryIBRD onlyIcelandIDA & IBRD totalIDA blendIDA onlyIDA totalIndiaIndonesiaIran, Islamic Rep.IraqIrelandIsraelItalyJamaicaJapanJordanKazakhstanKenyaKiribatiKorea, Rep.KuwaitKyrgyz RepublicLao PDRLate-demographic dividendLatin America & Caribbean Latin America & Caribbean (excluding high income)Latin America & the Caribbean (IDA & IBRD countries)LatviaLeast developed countries: UN classificationLebanonLesothoLiberiaLibyaLiechtensteinLithuaniaLow & middle incomeLow incomeLower middle incomeLuxembourgMacao SAR, ChinaMacedonia, FYRMadagascarMalawiMalaysiaMaldivesMaliMaltaMauritaniaMauritiusMexicoMiddle East & North AfricaMiddle East & North Africa (excluding high income)Middle East & North Africa (IDA & IBRD countries)Middle incomeMoldovaMonacoMongoliaMontenegroMoroccoMozambiqueMyanmarNamibiaNauruNepalNetherlandsNew ZealandNicaraguaNigerNorwayOECD membersOmanOther small statesPacific island small statesPakistanPalauPanamaPapua New GuineaParaguayPeruPhilippinesPolandPortugalPost-demographic dividendPre-demographic dividendQatarRomaniaRussian FederationRwandaSamoaSan MarinoSao Tome and PrincipeSaudi ArabiaSenegalSerbiaSeychellesSierra LeoneSingaporeSint Maarten (Dutch part)Slovak RepublicSloveniaSmall statesSolomon IslandsSomaliaSouth AfricaSouth AsiaSouth Asia (IDA & IBRD)South SudanSpainSri LankaSt. Kitts and NevisSt. LuciaSt. Vincent and the GrenadinesSub-Saharan Africa Sub-Saharan Africa (excluding high income)Sub-Saharan Africa (IDA & IBRD countries)SudanSurinameSwazilandSwedenSwitzerlandSyrian Arab RepublicTajikistanTanzaniaThailandTimor-LesteTogoTongaTrinidad and TobagoTunisiaTurkeyTurks and Caicos IslandsTuvaluUgandaUkraineUnited Arab EmiratesUnited KingdomUpper middle incomeUruguayUzbekistanVanuatuVenezuela, RBVietnamWest Bank and GazaWorldYemen, Rep.ZambiaZimbabwe
línea de tiempo (timeline):
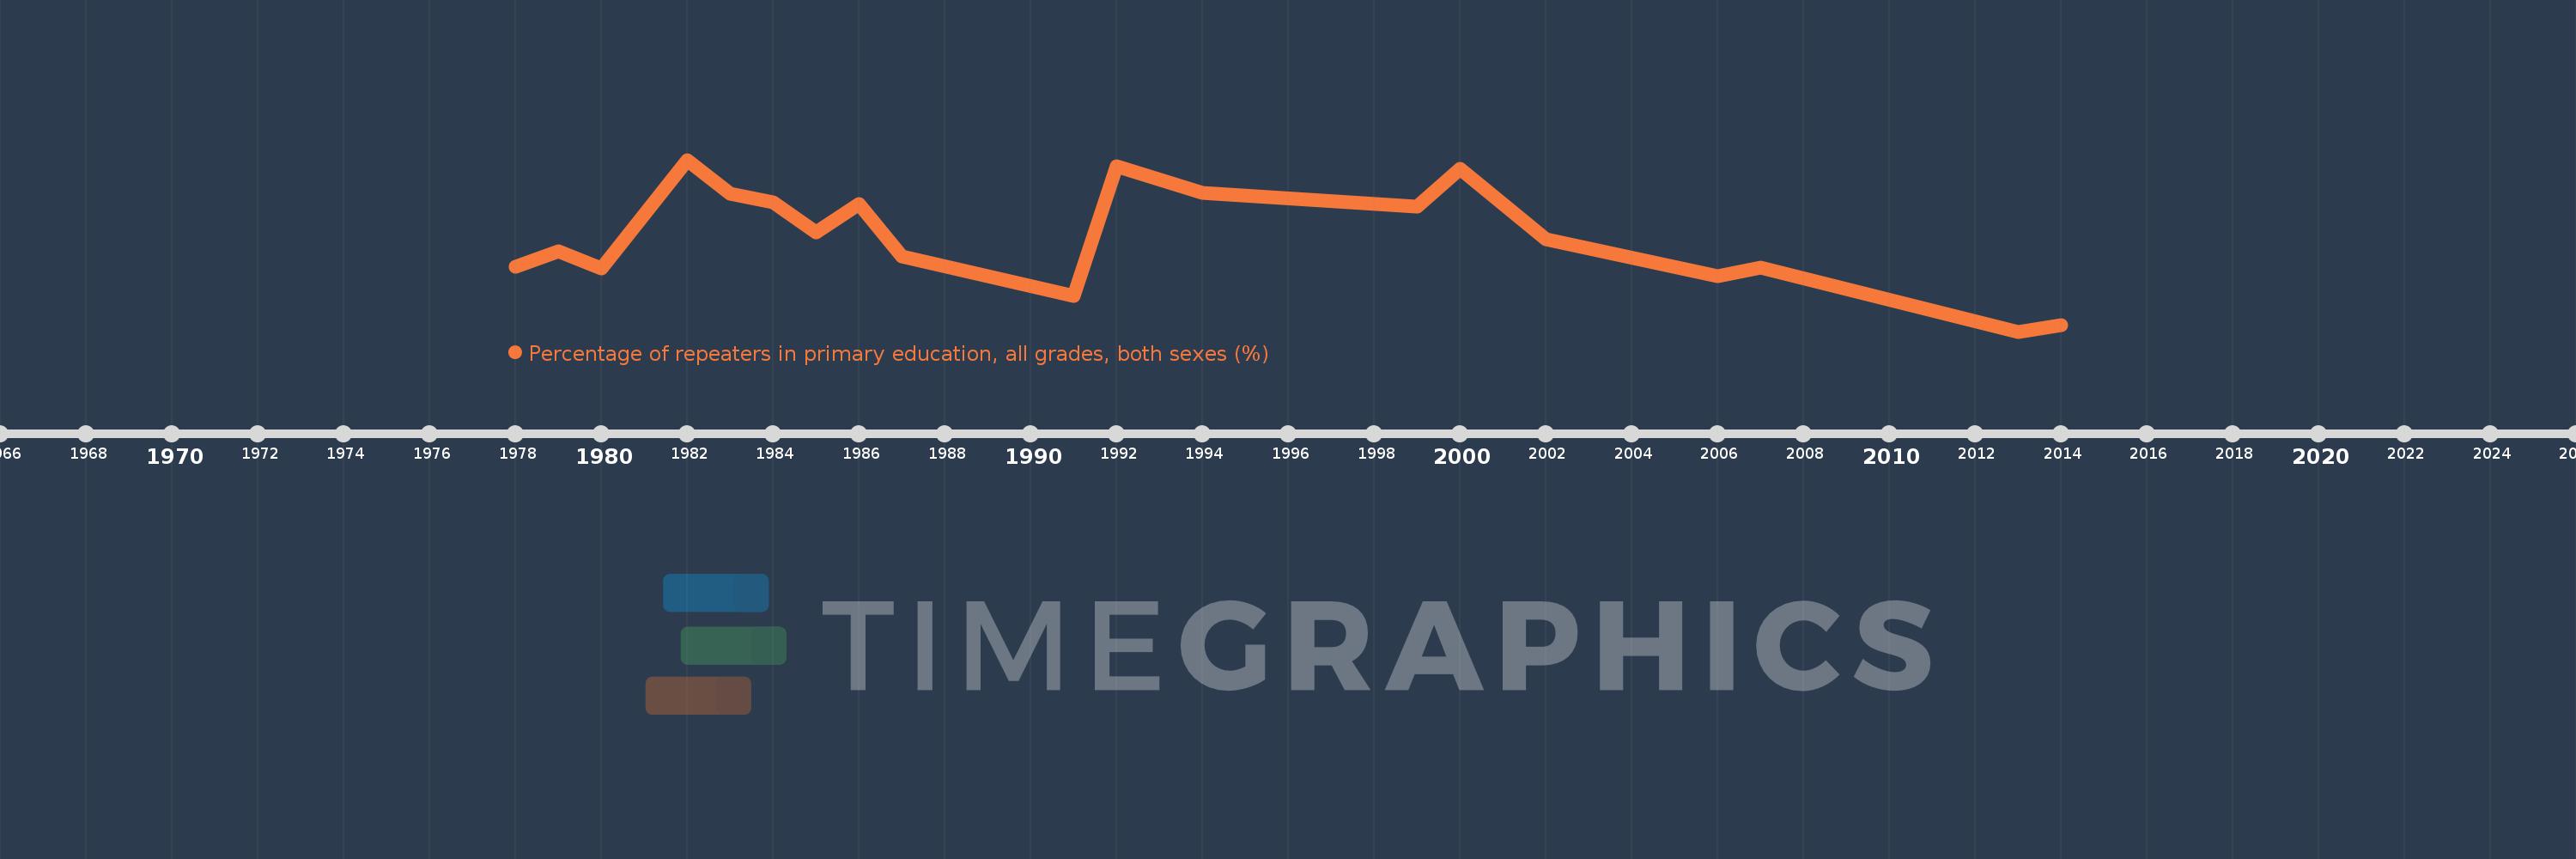
En esta escala de tiempo se presenta un gráfico de 1978 y 2014 de Tonga. Los datos de 1977 están ausentes. El número de observaciones reales por fecha: 19.
Fuente (nombre):
Indicadores del desarrollo mundial
Fuente (organización):
UNESCO Institute for Statistics
Categorías:
Education
Se ha actualizado:
23 abr 2017 año
Los indicadores de los cambios de valor en los últimos años
En promedio:
6.302
Mínimo:
2.81
1 ene 2013 año
Máximo:
9.163
1 ene 1982 año
A la fecha de observación
Valor
Cambio absoluto
El cambio con respecto al valor anterior
1 ene 1978 año
5.222
+5.222
0.0%
1 ene 1979 año
5.778
+0.556
10.64%
1 ene 1980 año
5.131
-0.647
-11.2%
1 ene 1982 año
9.163
+4.032
78.59%
1 ene 1983 año
7.904
-1.259
-13.74%
1 ene 1984 año
7.582
-0.322
-4.08%
1 ene 1985 año
6.489
-1.093
-14.41%
1 ene 1986 año
7.533
+1.044
16.09%
1 ene 1987 año
5.594
-1.939
-25.74%
1 ene 1991 año
4.116
-1.478
-26.42%
1 ene 1992 año
8.931
+4.815
117.0%
1 ene 1994 año
7.938
-0.993
-11.12%
1 ene 1999 año
7.43
-0.508
-6.4%
1 ene 2000 año
8.824
+1.394
18.77%
1 ene 2002 año
6.217
-2.607
-29.54%
1 ene 2006 año
4.844
-1.374
-22.09%
1 ene 2007 año
5.177
+0.333
6.87%
1 ene 2013 año
2.81
-2.366
-45.71%
1 ene 2014 año
3.049
+0.239
8.49%
Ranking de los países por los datos estadísticos actuales

Comentarios:

Enviar
PremiumAbout & FeedbackAcuerdoPrivacidad
logo
© 2022 Selected Technologies LLC – Morgan Hill, California