33
/es/
AIzaSyB4mHJ5NPEv-XzF7P6NDYXjlkCWaeKw5bc
November 1, 2025
233177
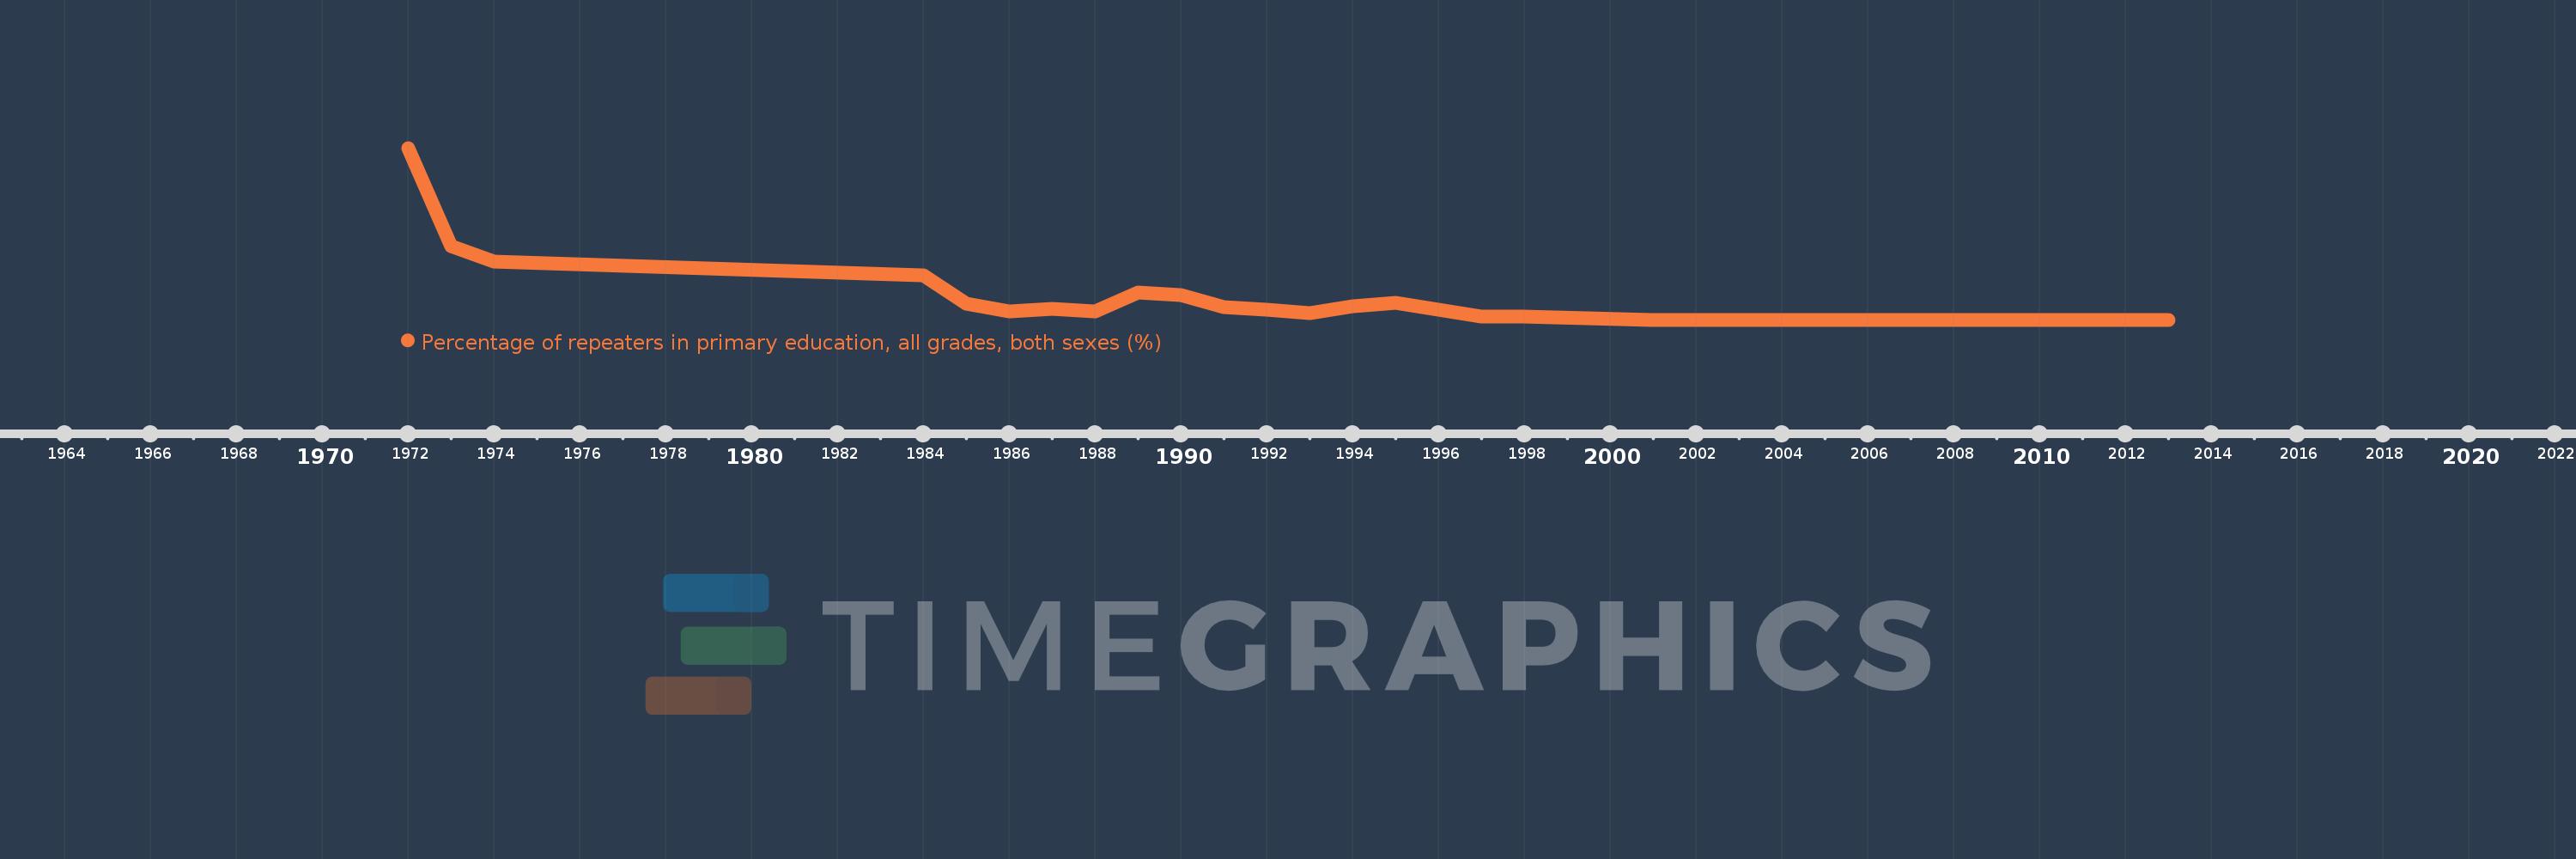
San Marino
SMR
true
2
1
Percentage of repeaters in primary education, all grades, both sexes (%)
2013,2012,2011,2010,2009,2005,2001,1998,1997,1995,1994,1993,1992,1991,1990,1989,1988,1987,1986,1985,1984,1974,1973,1972