33
/es/
AIzaSyB4mHJ5NPEv-XzF7P6NDYXjlkCWaeKw5bc
November 30, 2025
261719
Tanzania
TZA
true
2
1
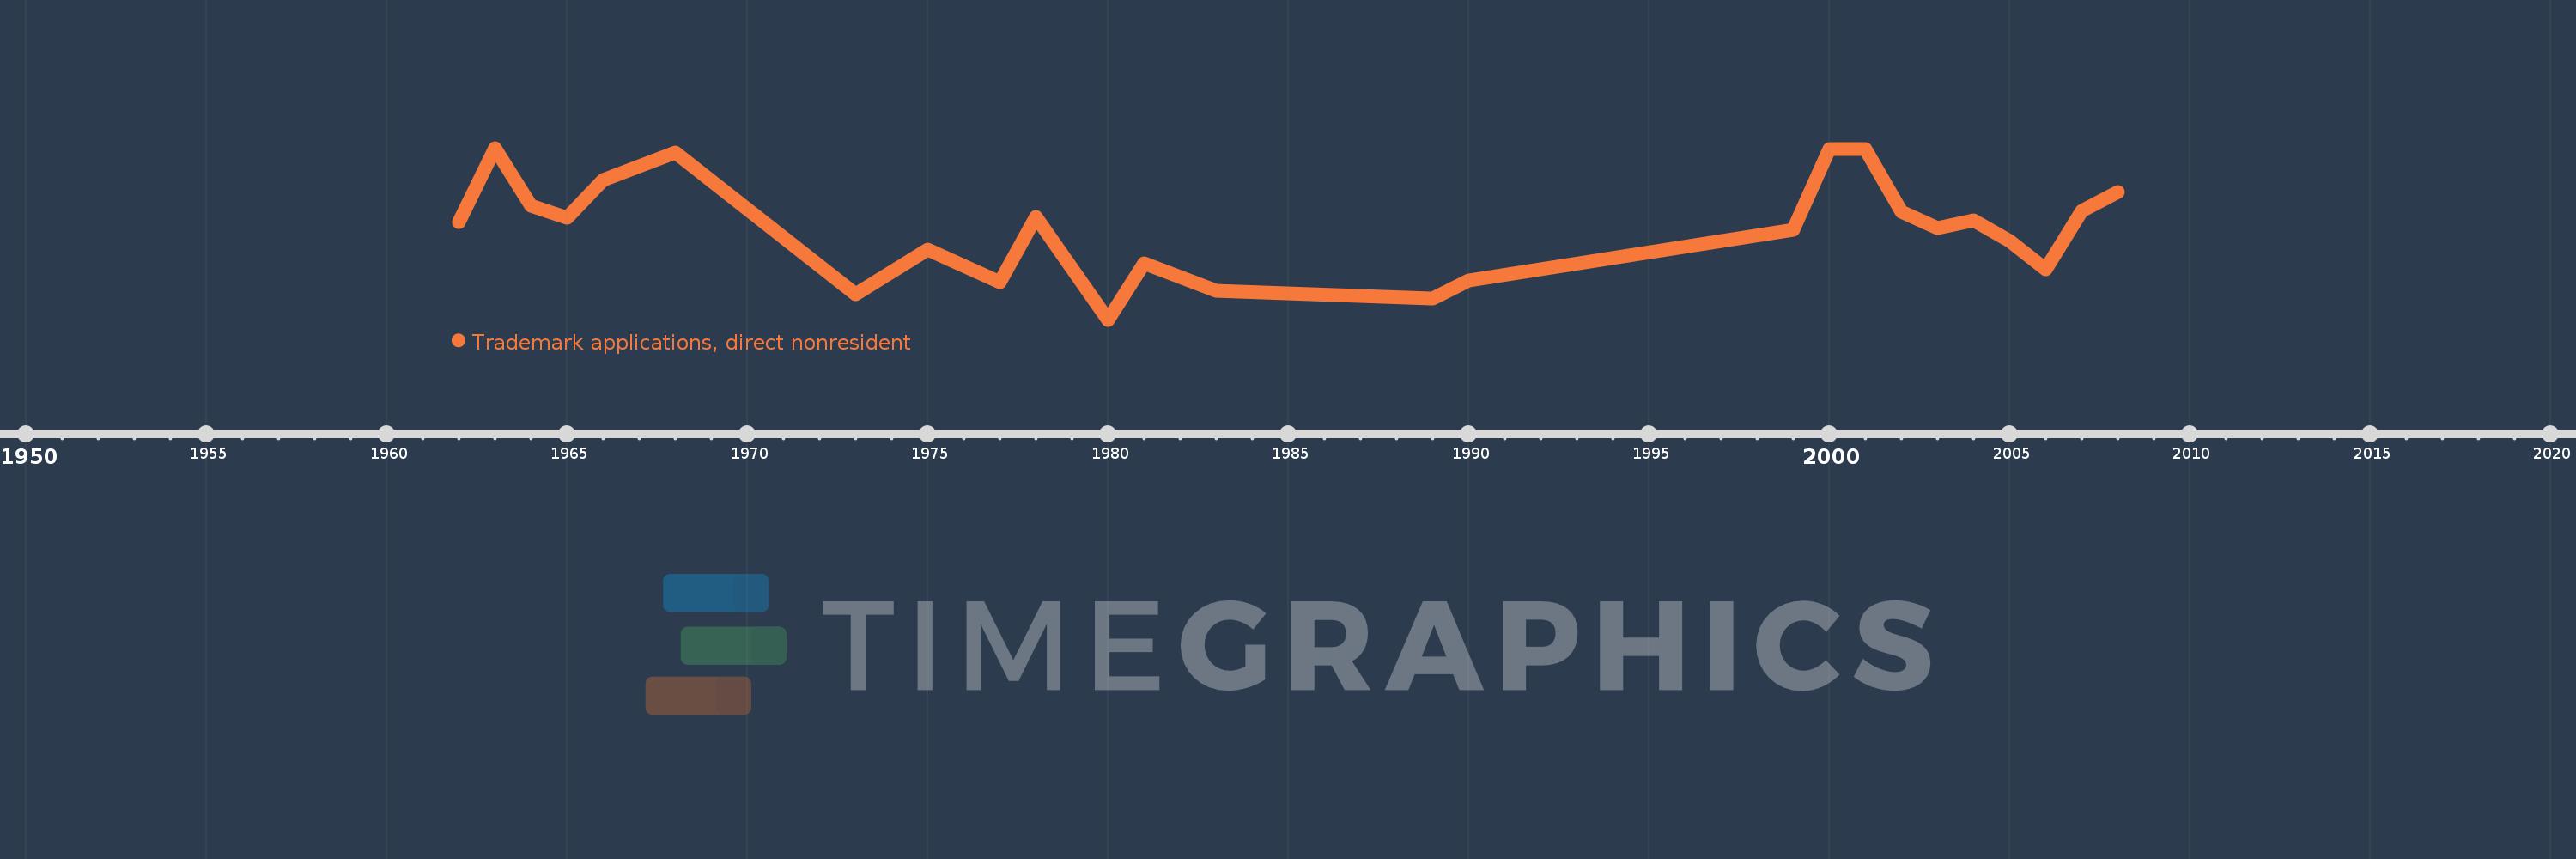
Trademark applications, direct nonresident
2008,2007,2006,2005,2004,2003,2002,2001,2000,1999,1990,1989,1983,1981,1980,1978,1977,1975,1973,1968,1966,1965,1964,1963,1962