33
/es/
AIzaSyAYiBZKx7MnpbEhh9jyipgxe19OcubqV5w
August 1, 2025
232893
Samoa
WSM
true
2
1
Trademark applications, direct nonresident
2015,2013,2008,2007,2005,2004,2000,1997,1996,1994,1992,1986,1985,1982,1981,1980,1979,1978,1977,1976,1975,1974
Download
Estadísticas Globales de la Biblioteca →Samoa →

Trademark applications, direct nonresident

Estas estadísticas en otros países:

AlbaniaAlgeriaAndorraAngolaAntigua and BarbudaArab WorldArgentinaArmeniaArubaAustraliaAustriaAzerbaijanBahamas, TheBahrainBangladeshBarbadosBelarusBelgiumBelizeBhutanBoliviaBosnia and HerzegovinaBotswanaBrazilBrunei DarussalamBulgariaBurundiCambodiaCanadaCaribbean small statesCentral Europe and the BalticsChileChinaColombiaCongo, Dem. Rep.Costa RicaCroatiaCubaCuracaoCyprusCzech RepublicDenmarkDjiboutiDominicaDominican RepublicEarly-demographic dividendEast Asia & PacificEast Asia & Pacific (excluding high income)East Asia & Pacific (IDA & IBRD countries)EcuadorEgypt, Arab Rep.El SalvadorEstoniaEthiopiaEuro areaEurope & Central AsiaEurope & Central Asia (excluding high income)Europe & Central Asia (IDA & IBRD countries)European UnionFijiFinlandFranceGambia, TheGeorgiaGermanyGhanaGreeceGrenadaGuatemalaGuyanaHaitiHigh incomeHondurasHong Kong SAR, ChinaHungaryIBRD onlyIcelandIDA & IBRD totalIDA blendIndiaIndonesiaIran, Islamic Rep.IraqIrelandIsraelItalyJamaicaJapanJordanKazakhstanKenyaKiribatiKorea, Dem. People’s Rep.Korea, Rep.KuwaitKyrgyz RepublicLao PDRLate-demographic dividendLatin America & Caribbean Latin America & Caribbean (excluding high income)Latin America & the Caribbean (IDA & IBRD countries)LatviaLebanonLesothoLiberiaLibyaLiechtensteinLithuaniaLow & middle incomeLower middle incomeLuxembourgMacao SAR, ChinaMacedonia, FYRMadagascarMalawiMalaysiaMaliMaltaMauritiusMexicoMiddle East & North AfricaMiddle East & North Africa (excluding high income)Middle East & North Africa (IDA & IBRD countries)Middle incomeMoldovaMonacoMongoliaMontenegroMoroccoMozambiqueMyanmarNamibiaNepalNetherlandsNew ZealandNicaraguaNigeriaNorth AmericaNorwayOECD membersOmanOther small statesPacific island small statesPakistanPanamaPapua New GuineaParaguayPeruPhilippinesPolandPortugalPost-demographic dividendQatarRomaniaRussian FederationRwandaSamoaSan MarinoSao Tome and PrincipeSaudi ArabiaSerbiaSeychellesSierra LeoneSingaporeSint Maarten (Dutch part)Slovak RepublicSloveniaSmall statesSolomon IslandsSomaliaSouth AfricaSouth AsiaSouth Asia (IDA & IBRD)SpainSri LankaSt. LuciaSt. Vincent and the GrenadinesSudanSurinameSwazilandSwedenSwitzerlandSyrian Arab RepublicTajikistanTanzaniaThailandTongaTrinidad and TobagoTunisiaTurkeyTurkmenistanTuvaluUgandaUkraineUnited Arab EmiratesUnited KingdomUnited StatesUpper middle incomeUruguayUzbekistanVenezuela, RBVietnamWorldYemen, Rep.ZambiaZimbabwe

línea de tiempo (timeline):

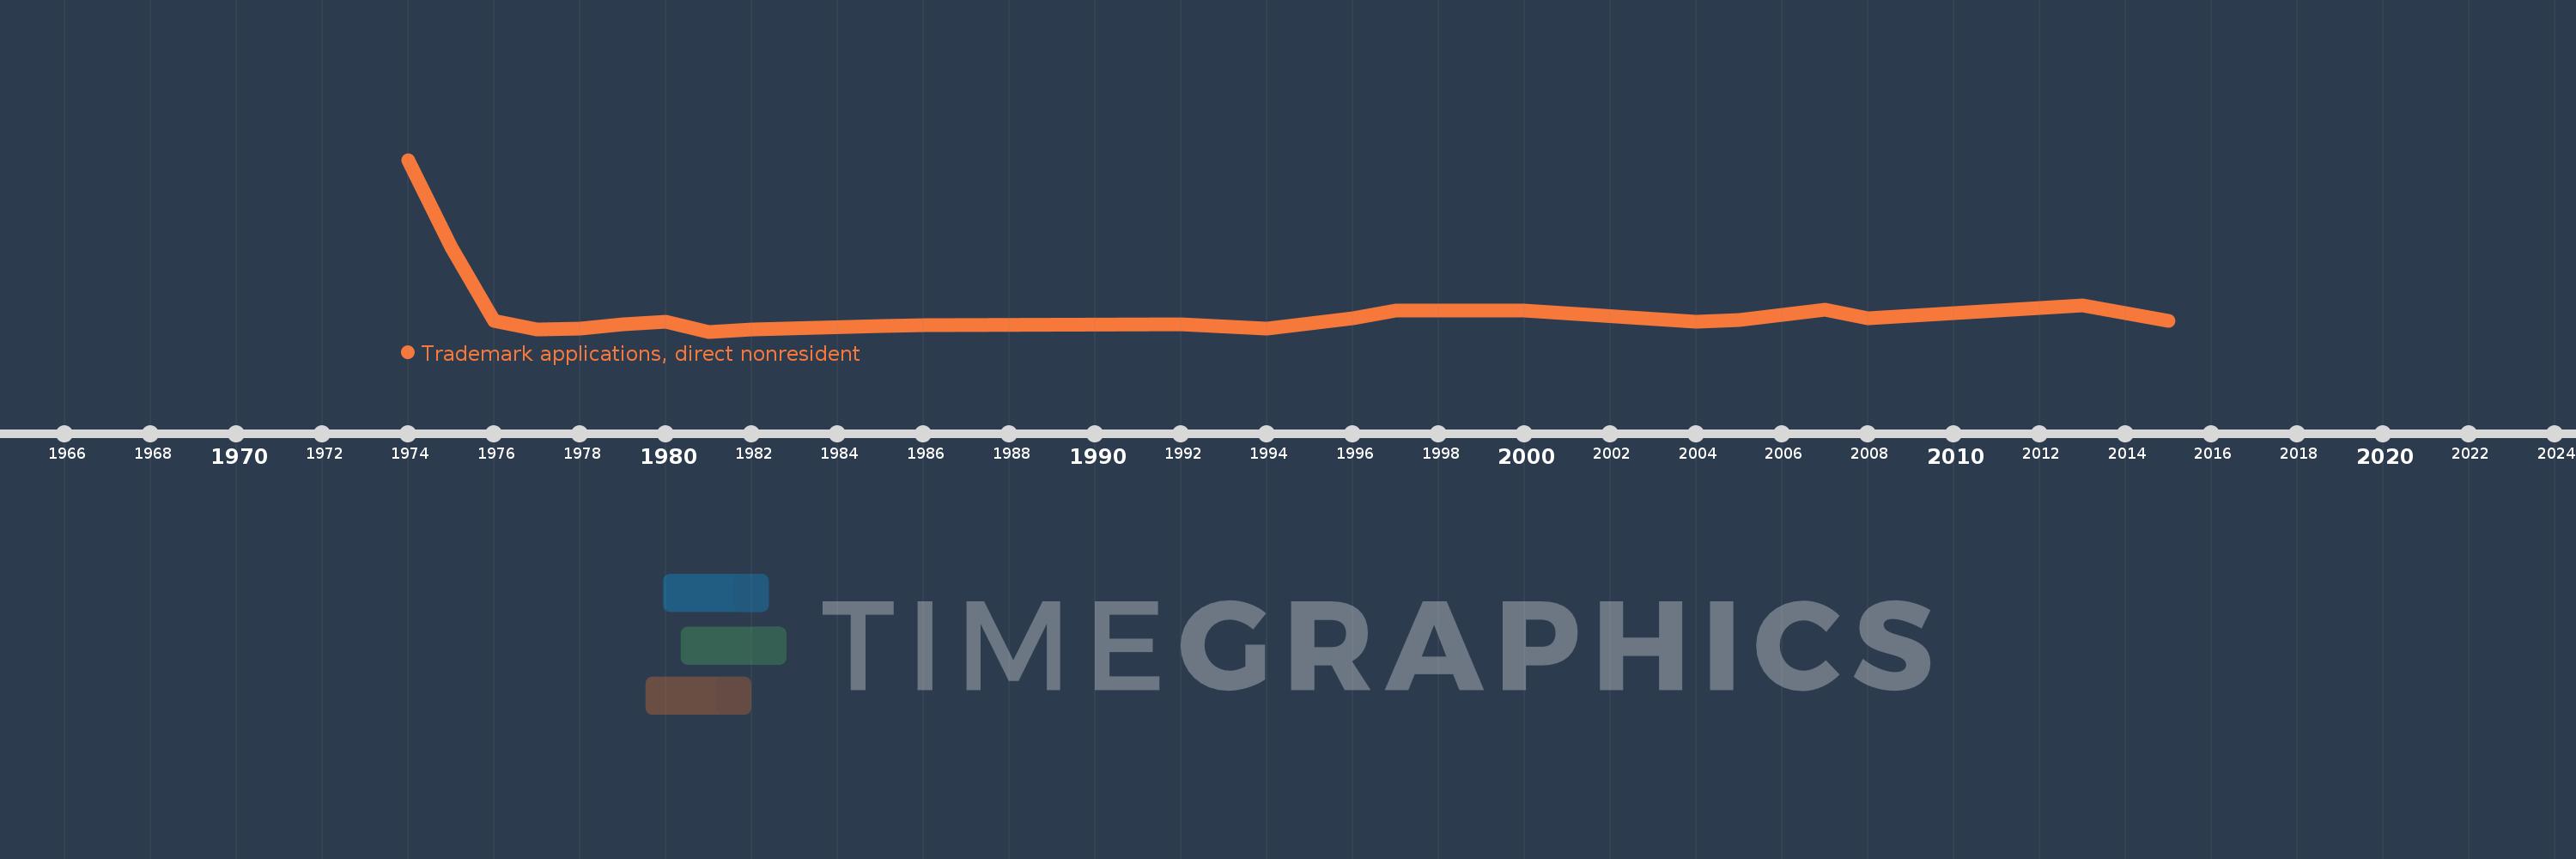
En esta escala de tiempo se presenta un gráfico de 1974 y 2015 de Samoa. Los datos de 1973 están ausentes. El número de observaciones reales por fecha: 22.

Fuente (nombre):

Indicadores del desarrollo mundial

Fuente (organización):

World Intellectual Property Organization (WIPO), WIPO Patent Report: Statistics on Worldwide Patent Activity. The International Bureau of WIPO assumes no responsibility with respect to the transformation of these data.

Categorías:

Science & Technology

Se ha actualizado:

23 abr 2017 año

Los indicadores de los cambios de valor en los últimos años

En promedio:
176.409
Mínimo:
55.0
1 ene 1981 año
Máximo:
1.05 mil
1 ene 1974 año
A la fecha de observación
Valor
Cambio absoluto
El cambio con respecto al valor anterior
1 ene 1974 año
1.05 mil
+1.05 mil
0.0%
1 ene 1975 año
545.0
-505.0
-48.1%
1 ene 1976 año
116.0
-429.0
-78.72%
1 ene 1977 año
68.0
-48.0
-41.38%
1 ene 1978 año
72.0
+4.0
5.88%
1 ene 1979 año
97.0
+25.0
34.72%
1 ene 1980 año
110.0
+13.0
13.4%
1 ene 1981 año
55.0
-55.0
-50.0%
1 ene 1982 año
66.0
+11.0
20.0%
1 ene 1985 año
85.0
+19.0
28.79%
1 ene 1986 año
90.0
+5.0
5.88%
1 ene 1992 año
99.0
+9.0
10.0%
1 ene 1994 año
73.0
-26.0
-26.26%
1 ene 1996 año
132.0
+59.0
80.82%
1 ene 1997 año
176.0
+44.0
33.33%
1 ene 2000 año
175.0
-1.0
-0.57%
1 ene 2004 año
113.0
-62.0
-35.43%
1 ene 2005 año
122.0
+9.0
7.96%
1 ene 2007 año
184.0
+62.0
50.82%
1 ene 2008 año
130.0
-54.0
-29.35%
1 ene 2013 año
205.0
+75.0
57.69%
1 ene 2015 año
118.0
-87.0
-42.44%

Ranking de los países por los datos estadísticos actuales