33
/es/
AIzaSyAYiBZKx7MnpbEhh9jyipgxe19OcubqV5w
May 1, 2025
207542
Nepal
NPL
true
2
1
Trademark applications, direct nonresident
2015,2014,2013,2012,2008,2007,2006,2005,2004,2003,2002,2001,2000,1999,1996,1985,1983,1982,1981,1980,1979,1978,1977,1974,1965
Download
Estadísticas Globales de la Biblioteca →Nepal →

Trademark applications, direct nonresident

Estas estadísticas en otros países:

AlbaniaAlgeriaAndorraAngolaAntigua and BarbudaArab WorldArgentinaArmeniaArubaAustraliaAustriaAzerbaijanBahamas, TheBahrainBangladeshBarbadosBelarusBelgiumBelizeBhutanBoliviaBosnia and HerzegovinaBotswanaBrazilBrunei DarussalamBulgariaBurundiCambodiaCanadaCaribbean small statesCentral Europe and the BalticsChileChinaColombiaCongo, Dem. Rep.Costa RicaCroatiaCubaCuracaoCyprusCzech RepublicDenmarkDjiboutiDominicaDominican RepublicEarly-demographic dividendEast Asia & PacificEast Asia & Pacific (excluding high income)East Asia & Pacific (IDA & IBRD countries)EcuadorEgypt, Arab Rep.El SalvadorEstoniaEthiopiaEuro areaEurope & Central AsiaEurope & Central Asia (excluding high income)Europe & Central Asia (IDA & IBRD countries)European UnionFijiFinlandFranceGambia, TheGeorgiaGermanyGhanaGreeceGrenadaGuatemalaGuyanaHaitiHigh incomeHondurasHong Kong SAR, ChinaHungaryIBRD onlyIcelandIDA & IBRD totalIDA blendIndiaIndonesiaIran, Islamic Rep.IraqIrelandIsraelItalyJamaicaJapanJordanKazakhstanKenyaKiribatiKorea, Dem. People’s Rep.Korea, Rep.KuwaitKyrgyz RepublicLao PDRLate-demographic dividendLatin America & Caribbean Latin America & Caribbean (excluding high income)Latin America & the Caribbean (IDA & IBRD countries)LatviaLebanonLesothoLiberiaLibyaLiechtensteinLithuaniaLow & middle incomeLower middle incomeLuxembourgMacao SAR, ChinaMacedonia, FYRMadagascarMalawiMalaysiaMaliMaltaMauritiusMexicoMiddle East & North AfricaMiddle East & North Africa (excluding high income)Middle East & North Africa (IDA & IBRD countries)Middle incomeMoldovaMonacoMongoliaMontenegroMoroccoMozambiqueMyanmarNamibiaNepalNetherlandsNew ZealandNicaraguaNigeriaNorth AmericaNorwayOECD membersOmanOther small statesPacific island small statesPakistanPanamaPapua New GuineaParaguayPeruPhilippinesPolandPortugalPost-demographic dividendQatarRomaniaRussian FederationRwandaSamoaSan MarinoSao Tome and PrincipeSaudi ArabiaSerbiaSeychellesSierra LeoneSingaporeSint Maarten (Dutch part)Slovak RepublicSloveniaSmall statesSolomon IslandsSomaliaSouth AfricaSouth AsiaSouth Asia (IDA & IBRD)SpainSri LankaSt. LuciaSt. Vincent and the GrenadinesSudanSurinameSwazilandSwedenSwitzerlandSyrian Arab RepublicTajikistanTanzaniaThailandTongaTrinidad and TobagoTunisiaTurkeyTurkmenistanTuvaluUgandaUkraineUnited Arab EmiratesUnited KingdomUnited StatesUpper middle incomeUruguayUzbekistanVenezuela, RBVietnamWorldYemen, Rep.ZambiaZimbabwe

línea de tiempo (timeline):

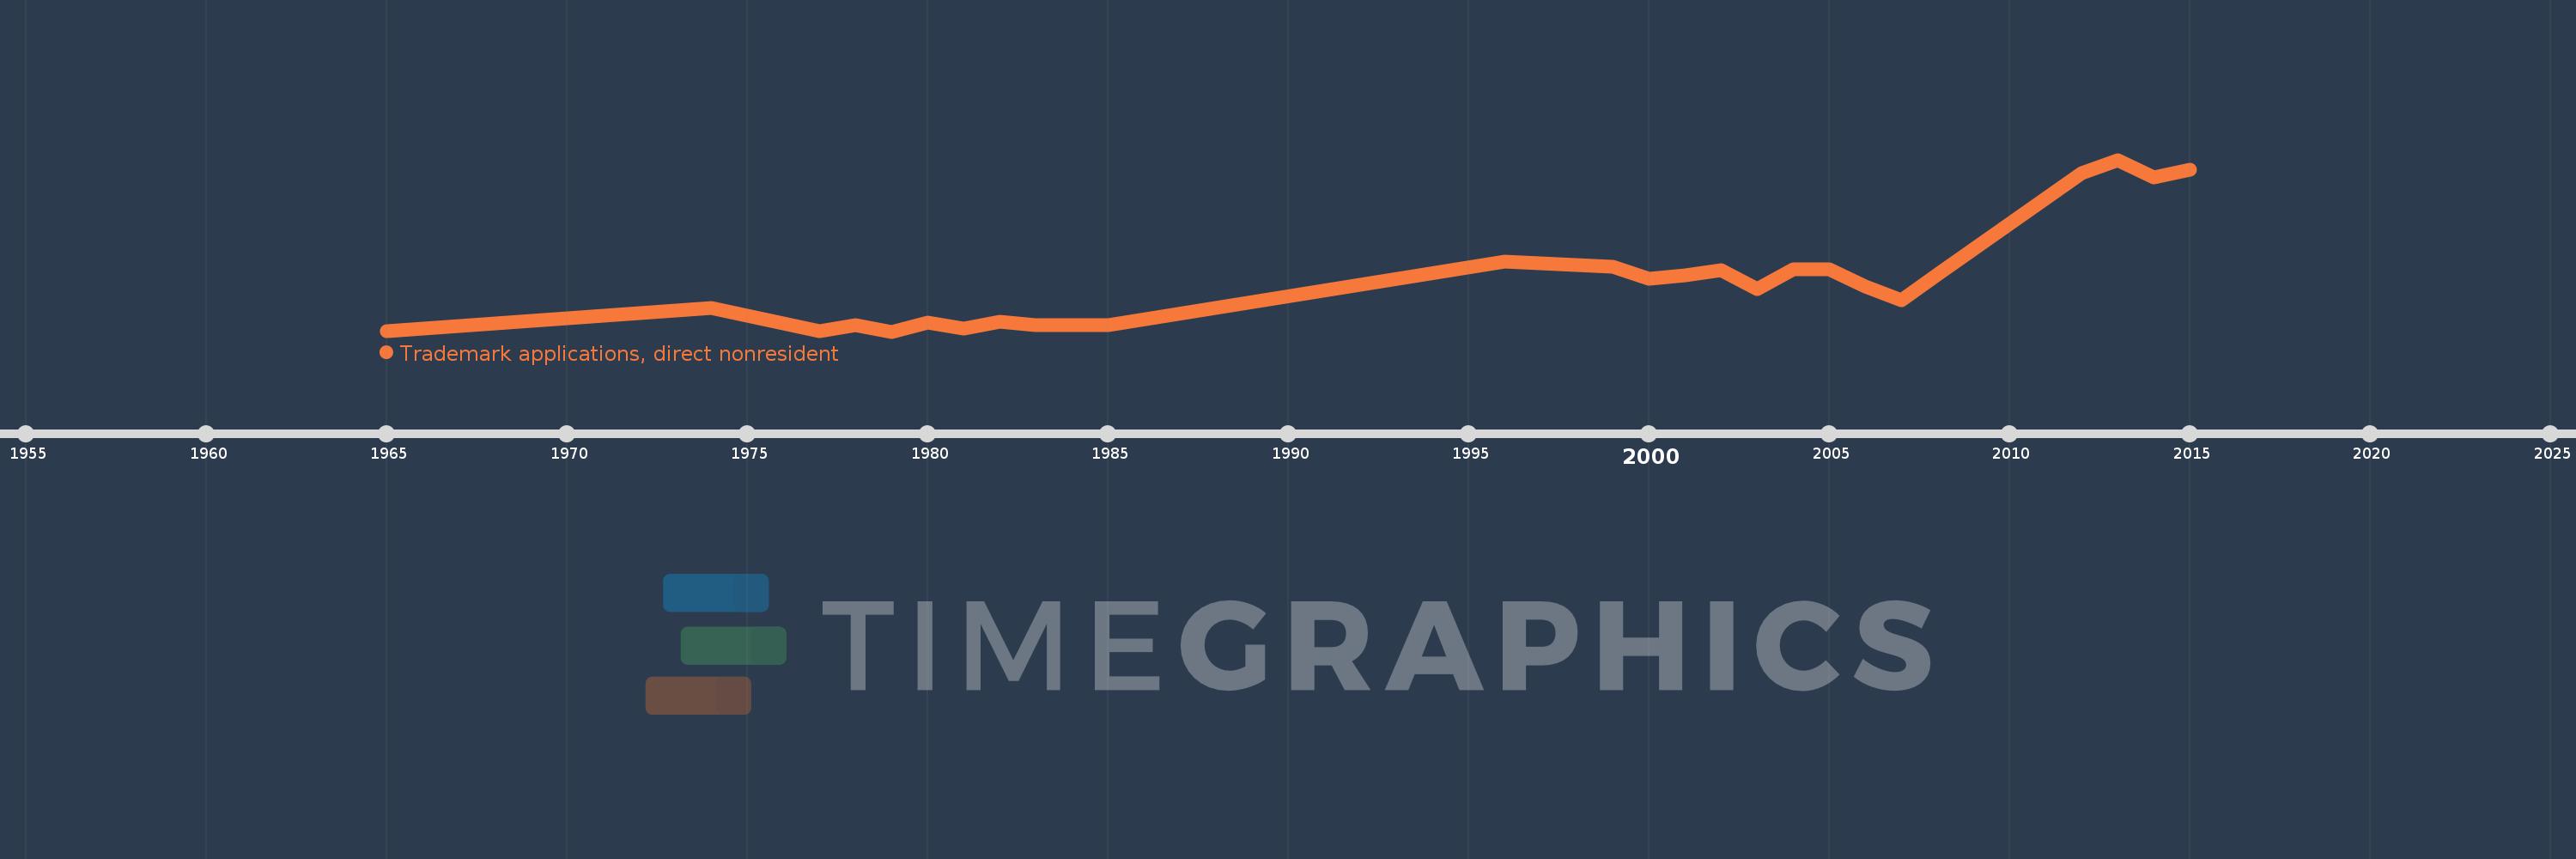
En esta escala de tiempo se presenta un gráfico de 1965 y 2015 de Nepal. Los datos de 1964 están ausentes. El número de observaciones reales por fecha: 25.

Fuente (nombre):

Indicadores del desarrollo mundial

Fuente (organización):

World Intellectual Property Organization (WIPO), WIPO Patent Report: Statistics on Worldwide Patent Activity. The International Bureau of WIPO assumes no responsibility with respect to the transformation of these data.

Categorías:

Science & Technology

Se ha actualizado:

23 abr 2017 año

Los indicadores de los cambios de valor en los últimos años

En promedio:
484.04
Mínimo:
38.0
1 ene 1979 año
Máximo:
1.49 mil
1 ene 2013 año
A la fecha de observación
Valor
Cambio absoluto
El cambio con respecto al valor anterior
1 ene 1965 año
39.0
+39.0
0.0%
1 ene 1974 año
240.0
+201.0
515.38%
1 ene 1977 año
43.0
-197.0
-82.08%
1 ene 1978 año
90.0
+47.0
109.3%
1 ene 1979 año
38.0
-52.0
-57.78%
1 ene 1980 año
116.0
+78.0
205.26%
1 ene 1981 año
67.0
-49.0
-42.24%
1 ene 1982 año
123.0
+56.0
83.58%
1 ene 1983 año
93.0
-30.0
-24.39%
1 ene 1985 año
92.0
-1.0
-1.08%
1 ene 1996 año
627.0
+535.0
581.52%
1 ene 1999 año
588.0
-39.0
-6.22%
1 ene 2000 año
485.0
-103.0
-17.52%
1 ene 2001 año
515.0
+30.0
6.19%
1 ene 2002 año
557.0
+42.0
8.16%
1 ene 2003 año
396.0
-161.0
-28.9%
1 ene 2004 año
567.0
+171.0
43.18%
1 ene 2005 año
565.0
-2.0
-0.35%
1 ene 2006 año
419.0
-146.0
-25.84%
1 ene 2007 año
303.0
-116.0
-27.68%
1 ene 2008 año
520.0
+217.0
71.62%
1 ene 2012 año
1.379 mil
+859.0
165.19%
1 ene 2013 año
1.49 mil
+111.0
8.05%
1 ene 2014 año
1.34 mil
-150.0
-10.07%
1 ene 2015 año
1.409 mil
+69.0
5.15%

Ranking de los países por los datos estadísticos actuales