33
/es/
AIzaSyB4mHJ5NPEv-XzF7P6NDYXjlkCWaeKw5bc
November 1, 2025
258961
Syrian Arab Republic
SYR
true
2
1
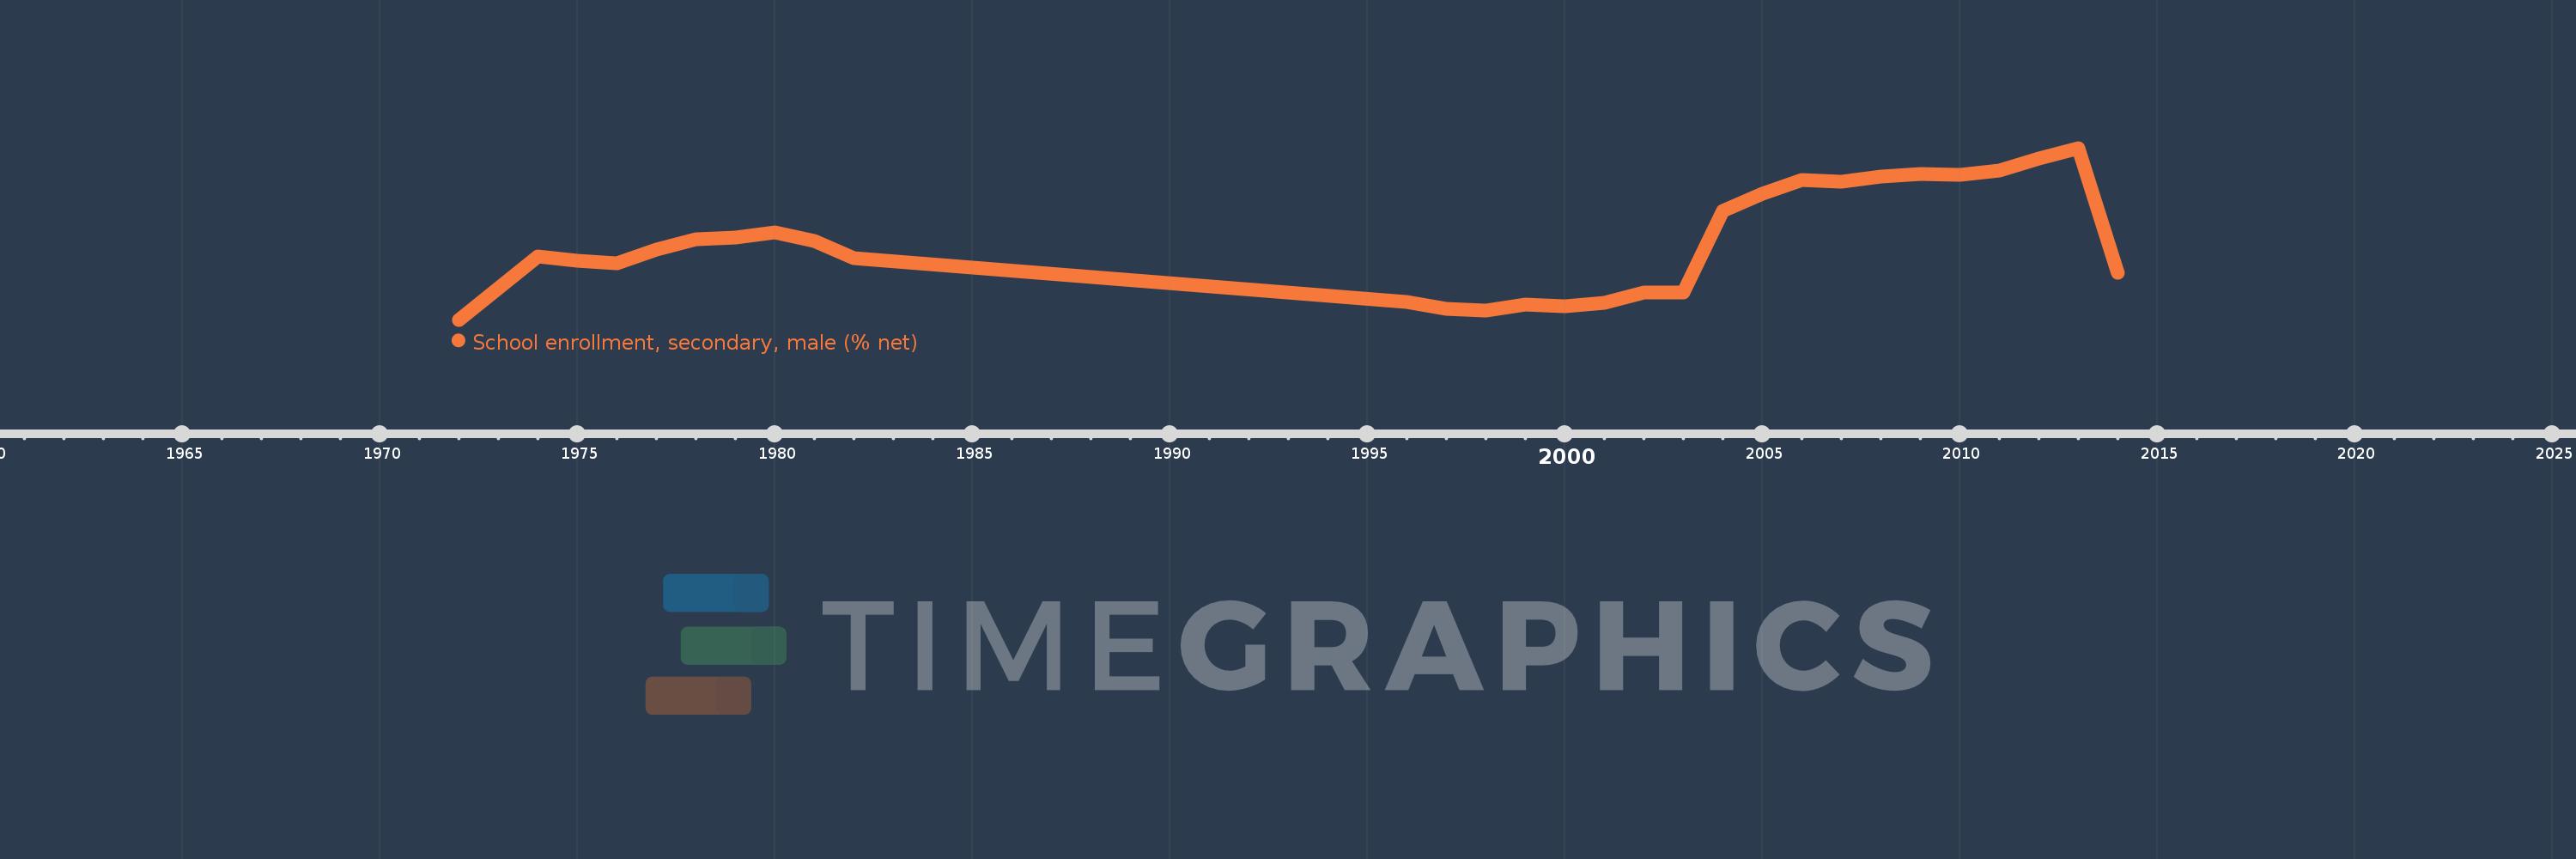
School enrollment, secondary, male (% net)
2014,2013,2012,2011,2010,2009,2008,2007,2006,2005,2004,2003,2002,2001,2000,1999,1998,1997,1996,1982,1981,1980,1979,1978,1977,1976,1975,1974,1972