33
/es/
AIzaSyAYiBZKx7MnpbEhh9jyipgxe19OcubqV5w
August 1, 2025
156706
Indonesia
IDN
true
2
1
School enrollment, secondary, male (% net)
2015,2014,2013,2012,2011,2010,2009,2008,2007,2006,2005,2004,2003,2002,1996,1979,1978,1977,1976,1975,1974,1973
Download
Estadísticas Globales de la Biblioteca →Indonesia →

School enrollment, secondary, male (% net)

Estas estadísticas en otros países:

AfghanistanAlbaniaAlgeriaAngolaAntigua and BarbudaArab WorldArgentinaArmeniaArubaAustraliaAzerbaijanBahamas, TheBahrainBangladeshBarbadosBelarusBelgiumBelizeBeninBermudaBhutanBoliviaBotswanaBrazilBrunei DarussalamBulgariaBurkina FasoBurundiCabo VerdeCambodiaCameroonCanadaCaribbean small statesCentral African RepublicCentral Europe and the BalticsChadChileColombiaComorosCongo, Dem. Rep.Congo, Rep.Costa RicaCroatiaCubaCyprusDenmarkDjiboutiDominicaDominican RepublicEarly-demographic dividendEast Asia & PacificEast Asia & Pacific (excluding high income)East Asia & Pacific (IDA & IBRD countries)EcuadorEgypt, Arab Rep.El SalvadorEquatorial GuineaEritreaEstoniaEthiopiaEuro areaEurope & Central AsiaEurope & Central Asia (excluding high income)Europe & Central Asia (IDA & IBRD countries)European UnionFijiFinlandFragile and conflict affected situationsFranceGambia, TheGeorgiaGhanaGreeceGrenadaGuatemalaGuineaGuinea-BissauGuyanaHeavily indebted poor countries (HIPC)High incomeHondurasHong Kong SAR, ChinaHungaryIBRD onlyIcelandIDA & IBRD totalIDA blendIDA onlyIDA totalIndiaIndonesiaIran, Islamic Rep.IraqIrelandIsraelItalyJamaicaJapanJordanKazakhstanKenyaKiribatiKorea, Rep.KuwaitKyrgyz RepublicLao PDRLate-demographic dividendLatin America & Caribbean Latin America & Caribbean (excluding high income)Latin America & the Caribbean (IDA & IBRD countries)LatviaLeast developed countries: UN classificationLebanonLesothoLibyaLiechtensteinLithuaniaLow & middle incomeLow incomeLower middle incomeLuxembourgMacao SAR, ChinaMacedonia, FYRMadagascarMalawiMaldivesMaliMaltaMarshall IslandsMauritaniaMauritiusMexicoMiddle East & North AfricaMiddle East & North Africa (excluding high income)Middle East & North Africa (IDA & IBRD countries)Middle incomeMoldovaMongoliaMoroccoMozambiqueMyanmarNamibiaNauruNepalNetherlandsNew ZealandNicaraguaNigerNorth AmericaNorwayOECD membersOmanOther small statesPacific island small statesPakistanPanamaParaguayPeruPhilippinesPolandPortugalPost-demographic dividendPre-demographic dividendPuerto RicoQatarRomaniaSamoaSao Tome and PrincipeSaudi ArabiaSenegalSerbiaSeychellesSierra LeoneSloveniaSmall statesSolomon IslandsSomaliaSouth AfricaSouth AsiaSouth Asia (IDA & IBRD)SpainSri LankaSt. Kitts and NevisSt. LuciaSt. Vincent and the GrenadinesSub-Saharan Africa Sub-Saharan Africa (excluding high income)Sub-Saharan Africa (IDA & IBRD countries)SurinameSwazilandSwedenSwitzerlandSyrian Arab RepublicTajikistanThailandTimor-LesteTogoTongaTrinidad and TobagoTunisiaTurkeyTuvaluUgandaUkraineUnited Arab EmiratesUnited KingdomUnited StatesUpper middle incomeUruguayVanuatuVenezuela, RBWest Bank and GazaWorldYemen, Rep.Zimbabwe

línea de tiempo (timeline):

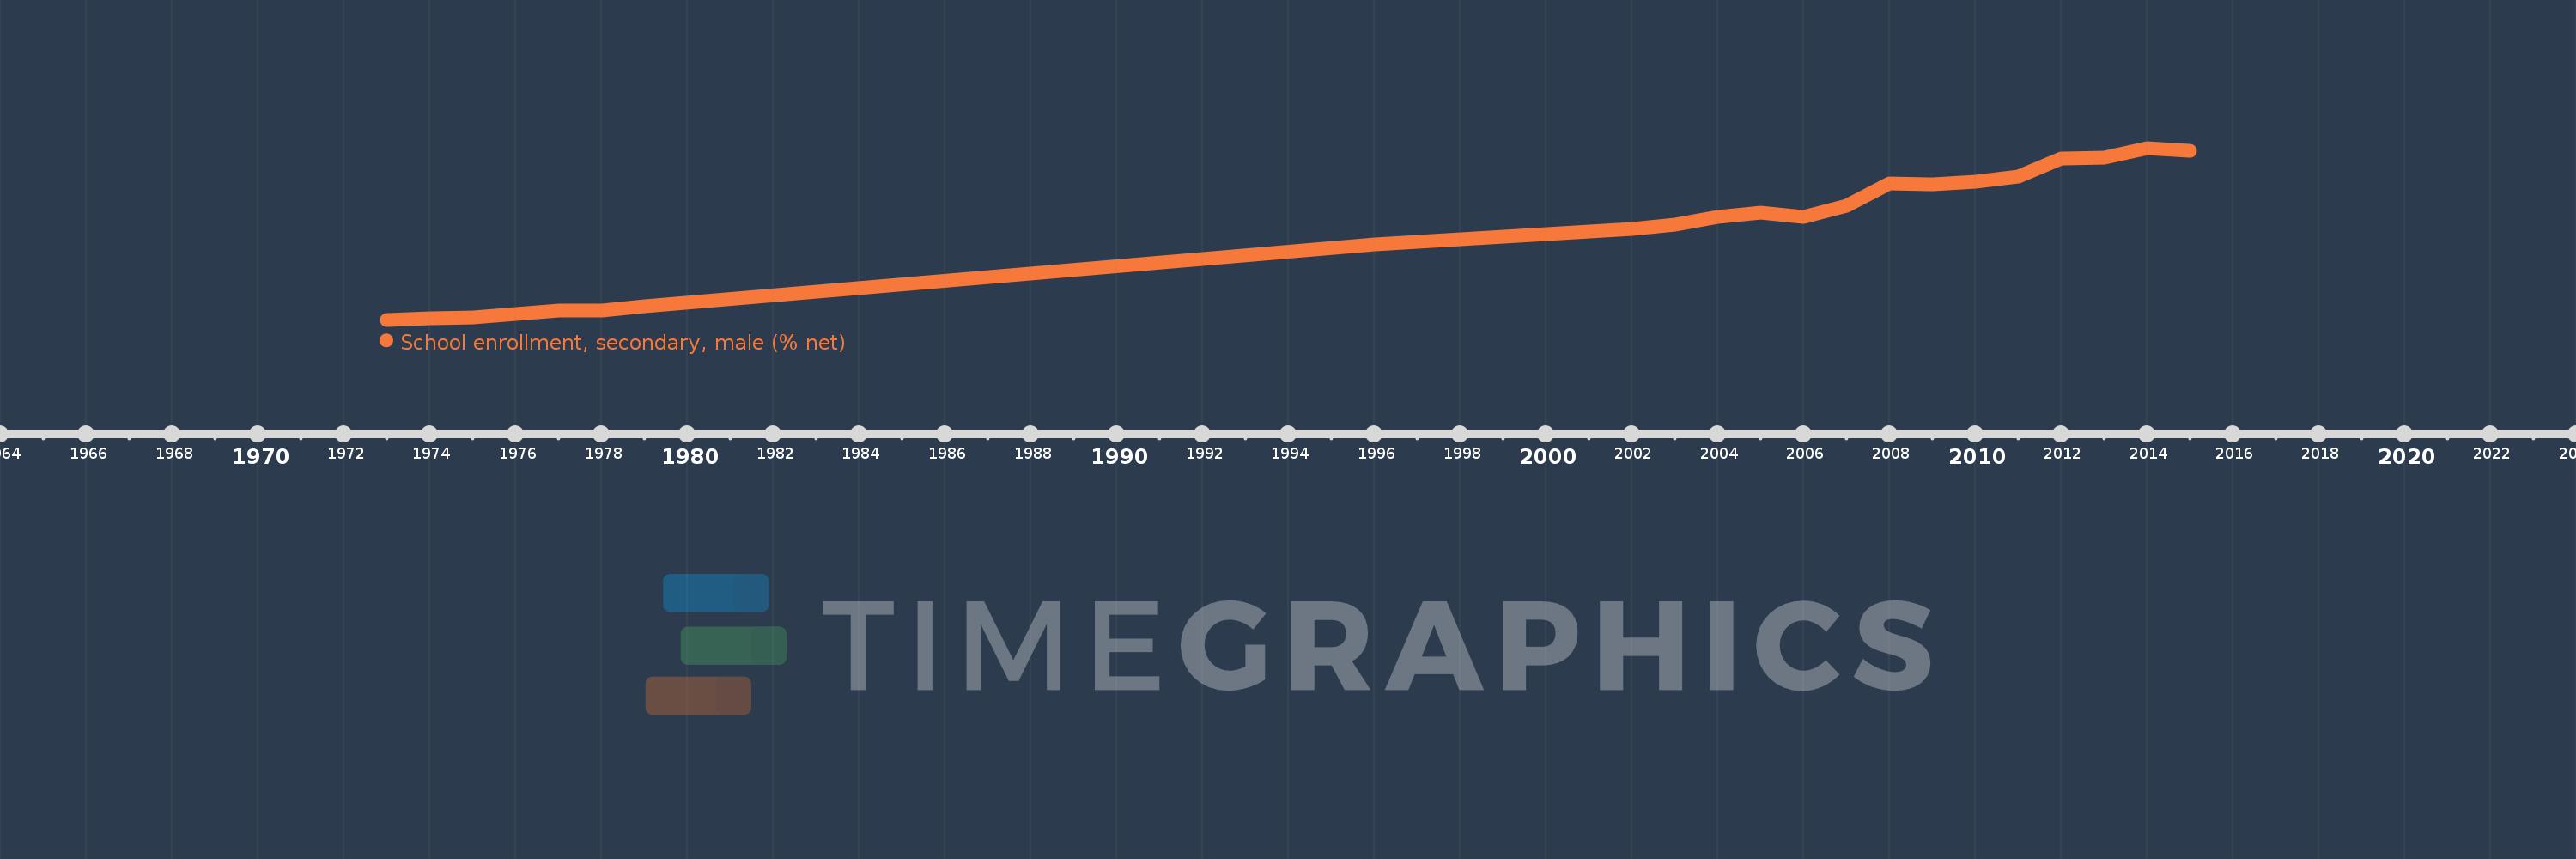
En esta escala de tiempo se presenta un gráfico de 1973 y 2015 de Indonesia. Los datos de 1972 están ausentes. El número de observaciones reales por fecha: 22.

Fuente (nombre):

Indicadores del desarrollo mundial

Fuente (organización):

United Nations Educational, Scientific, and Cultural Organization (UNESCO) Institute for Statistics.

Categorías:

Education, Gender

Se ha actualizado:

23 abr 2017 año

Los indicadores de los cambios de valor en los últimos años

En promedio:
49.068
Mínimo:
20.265
1 ene 1973 año
Máximo:
76.198
1 ene 2014 año
A la fecha de observación
Valor
Cambio absoluto
El cambio con respecto al valor anterior
1 ene 1973 año
20.265
+20.265
0.0%
1 ene 1974 año
20.665
+0.4
1.97%
1 ene 1975 año
21.08
+0.415
2.01%
1 ene 1976 año
22.161
+1.082
5.13%
1 ene 1977 año
23.135
+0.973
4.39%
1 ene 1978 año
23.303
+0.168
0.73%
1 ene 1979 año
24.573
+1.27
5.45%
1 ene 1996 año
44.818
+20.245
82.39%
1 ene 2002 año
49.913
+5.095
11.37%
1 ene 2003 año
51.128
+1.215
2.43%
1 ene 2004 año
53.834
+2.706
5.29%
1 ene 2005 año
55.115
+1.28
2.38%
1 ene 2006 año
53.643
-1.472
-2.67%
1 ene 2007 año
57.295
+3.652
6.81%
1 ene 2008 año
64.662
+7.368
12.86%
1 ene 2009 año
64.321
-0.342
-0.53%
1 ene 2010 año
65.327
+1.006
1.56%
1 ene 2011 año
66.865
+1.538
2.36%
1 ene 2012 año
72.819
+5.954
8.9%
1 ene 2013 año
73.056
+0.238
0.33%
1 ene 2014 año
76.198
+3.141
4.3%
1 ene 2015 año
75.331
-0.867
-1.14%

Ranking de los países por los datos estadísticos actuales