33
/es/
AIzaSyAYiBZKx7MnpbEhh9jyipgxe19OcubqV5w
May 1, 2025
226382
Portugal
PRT
true
2
1
School enrollment, secondary, male (% net)
2007,2006,2004,2003,2002,2001,2000,1996,1995,1994,1979,1977,1975,1974
Download
Estadísticas Globales de la Biblioteca →Portugal →

School enrollment, secondary, male (% net)

Estas estadísticas en otros países:

AfghanistanAlbaniaAlgeriaAngolaAntigua and BarbudaArab WorldArgentinaArmeniaArubaAustraliaAzerbaijanBahamas, TheBahrainBangladeshBarbadosBelarusBelgiumBelizeBeninBermudaBhutanBoliviaBotswanaBrazilBrunei DarussalamBulgariaBurkina FasoBurundiCabo VerdeCambodiaCameroonCanadaCaribbean small statesCentral African RepublicCentral Europe and the BalticsChadChileColombiaComorosCongo, Dem. Rep.Congo, Rep.Costa RicaCroatiaCubaCyprusDenmarkDjiboutiDominicaDominican RepublicEarly-demographic dividendEast Asia & PacificEast Asia & Pacific (excluding high income)East Asia & Pacific (IDA & IBRD countries)EcuadorEgypt, Arab Rep.El SalvadorEquatorial GuineaEritreaEstoniaEthiopiaEuro areaEurope & Central AsiaEurope & Central Asia (excluding high income)Europe & Central Asia (IDA & IBRD countries)European UnionFijiFinlandFragile and conflict affected situationsFranceGambia, TheGeorgiaGhanaGreeceGrenadaGuatemalaGuineaGuinea-BissauGuyanaHeavily indebted poor countries (HIPC)High incomeHondurasHong Kong SAR, ChinaHungaryIBRD onlyIcelandIDA & IBRD totalIDA blendIDA onlyIDA totalIndiaIndonesiaIran, Islamic Rep.IraqIrelandIsraelItalyJamaicaJapanJordanKazakhstanKenyaKiribatiKorea, Rep.KuwaitKyrgyz RepublicLao PDRLate-demographic dividendLatin America & Caribbean Latin America & Caribbean (excluding high income)Latin America & the Caribbean (IDA & IBRD countries)LatviaLeast developed countries: UN classificationLebanonLesothoLibyaLiechtensteinLithuaniaLow & middle incomeLow incomeLower middle incomeLuxembourgMacao SAR, ChinaMacedonia, FYRMadagascarMalawiMaldivesMaliMaltaMarshall IslandsMauritaniaMauritiusMexicoMiddle East & North AfricaMiddle East & North Africa (excluding high income)Middle East & North Africa (IDA & IBRD countries)Middle incomeMoldovaMongoliaMoroccoMozambiqueMyanmarNamibiaNauruNepalNetherlandsNew ZealandNicaraguaNigerNorth AmericaNorwayOECD membersOmanOther small statesPacific island small statesPakistanPanamaParaguayPeruPhilippinesPolandPortugalPost-demographic dividendPre-demographic dividendPuerto RicoQatarRomaniaSamoaSao Tome and PrincipeSaudi ArabiaSenegalSerbiaSeychellesSierra LeoneSloveniaSmall statesSolomon IslandsSomaliaSouth AfricaSouth AsiaSouth Asia (IDA & IBRD)SpainSri LankaSt. Kitts and NevisSt. LuciaSt. Vincent and the GrenadinesSub-Saharan Africa Sub-Saharan Africa (excluding high income)Sub-Saharan Africa (IDA & IBRD countries)SurinameSwazilandSwedenSwitzerlandSyrian Arab RepublicTajikistanThailandTimor-LesteTogoTongaTrinidad and TobagoTunisiaTurkeyTuvaluUgandaUkraineUnited Arab EmiratesUnited KingdomUnited StatesUpper middle incomeUruguayVanuatuVenezuela, RBWest Bank and GazaWorldYemen, Rep.Zimbabwe

línea de tiempo (timeline):

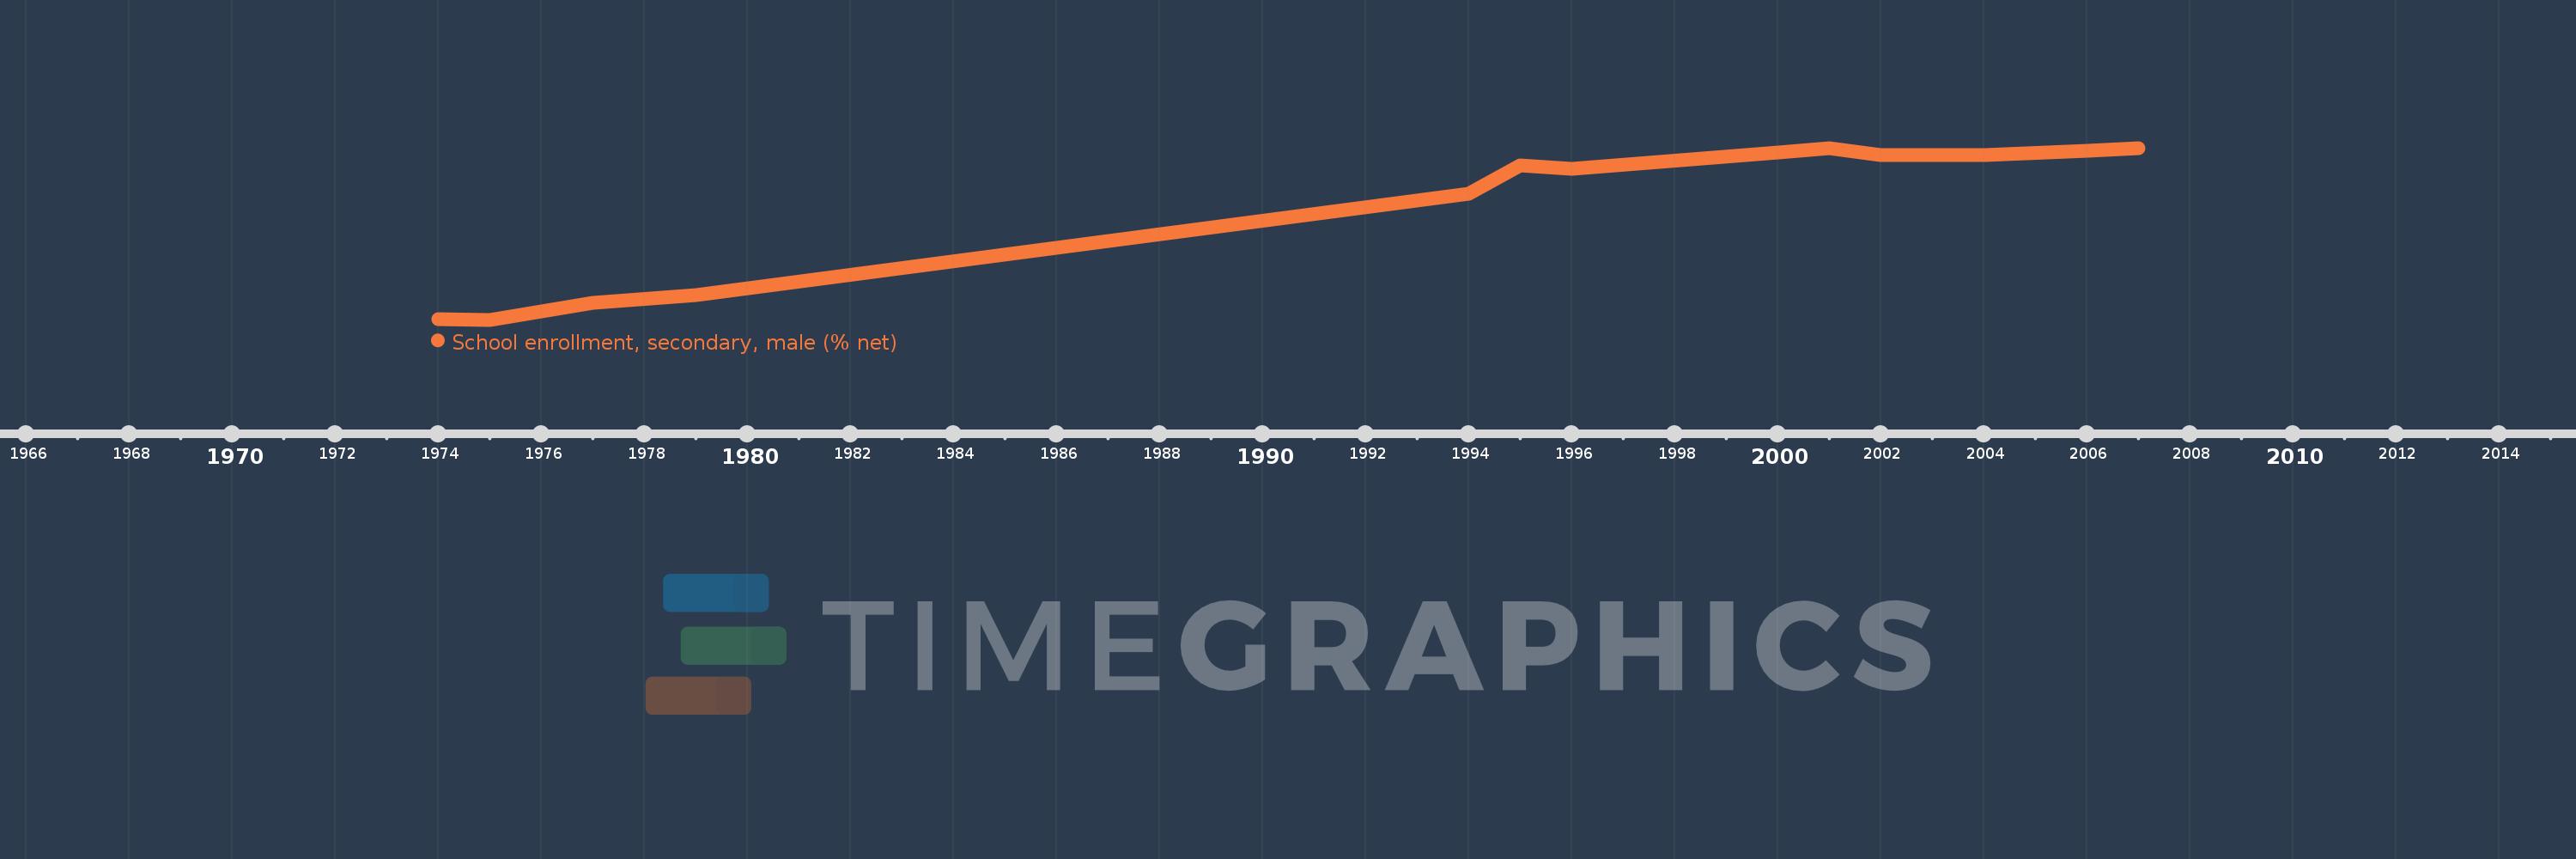
En esta escala de tiempo se presenta un gráfico de 1974 y 2007 de Portugal. Los datos de 1973 están ausentes. El número de observaciones reales por fecha: 14.

Fuente (nombre):

Indicadores del desarrollo mundial

Fuente (organización):

United Nations Educational, Scientific, and Cultural Organization (UNESCO) Institute for Statistics.

Categorías:

Education, Gender

Se ha actualizado:

23 abr 2017 año

Los indicadores de los cambios de valor en los últimos años

En promedio:
61.462
Mínimo:
23.684
1 ene 1975 año
Máximo:
78.841
1 ene 2007 año
A la fecha de observación
Valor
Cambio absoluto
El cambio con respecto al valor anterior
1 ene 1974 año
23.925
+23.925
0.0%
1 ene 1975 año
23.684
-0.24
-1.0%
1 ene 1977 año
29.229
+5.545
23.41%
1 ene 1979 año
31.56
+2.331
7.98%
1 ene 1994 año
64.188
+32.628
103.38%
1 ene 1995 año
73.219
+9.031
14.07%
1 ene 1996 año
72.203
-1.016
-1.39%
1 ene 2000 año
77.47
+5.267
7.29%
1 ene 2001 año
78.782
+1.313
1.69%
1 ene 2002 año
76.436
-2.346
-2.98%
1 ene 2003 año
76.6
+0.164
0.21%
1 ene 2004 año
76.431
-0.169
-0.22%
1 ene 2006 año
77.9
+1.469
1.92%
1 ene 2007 año
78.841
+0.941
1.21%

Ranking de los países por los datos estadísticos actuales