29
/es/
es
AIzaSyAYiBZKx7MnpbEhh9jyipgxe19OcubqV5w
April 1, 2024
258397
Syrian Arab Republic
SYR
true
2
1
Gross value added at factor cost (constant LCU)
2003,2002,2001,2000,1999,1998,1997,1996,1995,1994,1993,1992,1991,1990,1989,1988,1987,1986
Download
Estadísticas Globales de la Biblioteca →Syrian Arab Republic →

Gross value added at factor cost (constant LCU)

Estas estadísticas en otros países:
AfghanistanAlbaniaAlgeriaAntigua and BarbudaArgentinaArmeniaAustraliaAustriaAzerbaijanBahamas, TheBangladeshBelarusBelgiumBelizeBeninBermudaBhutanBoliviaBosnia and HerzegovinaBotswanaBrazilBulgariaBurkina FasoBurundiCabo VerdeCambodiaCameroonCanadaCayman IslandsCentral African RepublicChadChileColombiaCongo, Dem. Rep.Costa RicaCote d'IvoireCroatiaCubaCyprusCzech RepublicDenmarkDjiboutiDominicaDominican RepublicEcuadorEgypt, Arab Rep.El SalvadorEquatorial GuineaEritreaEstoniaEthiopiaFijiFinlandFranceGabonGambia, TheGeorgiaGermanyGhanaGreeceGrenadaGuatemalaGuineaGuinea-BissauGuyanaHaitiHondurasHong Kong SAR, ChinaHungaryIcelandIndiaIndonesiaIran, Islamic Rep.IrelandItalyJamaicaJapanJordanKazakhstanKenyaKiribatiKorea, Rep.KosovoKuwaitKyrgyz RepublicLao PDRLatviaLebanonLesothoLiberiaLithuaniaLuxembourgMacedonia, FYRMadagascarMalawiMaldivesMaliMarshall IslandsMauritaniaMauritiusMexicoMicronesia, Fed. Sts.MoldovaMongoliaMontenegroMoroccoMozambiqueNamibiaNepalNetherlandsNew ZealandNicaraguaNigeriaNorwayOmanPakistanPalauPanamaPapua New GuineaParaguayPeruPhilippinesPolandPortugalRomaniaRussian FederationRwandaSao Tome and PrincipeSenegalSerbiaSeychellesSierra LeoneSingaporeSlovak RepublicSloveniaSolomon IslandsSomaliaSouth AfricaSpainSri LankaSt. Kitts and NevisSt. LuciaSt. Vincent and the GrenadinesSudanSurinameSwazilandSwedenSwitzerlandSyrian Arab RepublicTajikistanTanzaniaThailandTimor-LesteTongaTrinidad and TobagoTunisiaTurkeyTurkmenistanTuvaluUgandaUkraineUnited Arab EmiratesUnited KingdomUnited StatesUruguayUzbekistanVanuatuVenezuela, RBVietnamWest Bank and GazaZambiaZimbabwe
línea de tiempo (timeline):
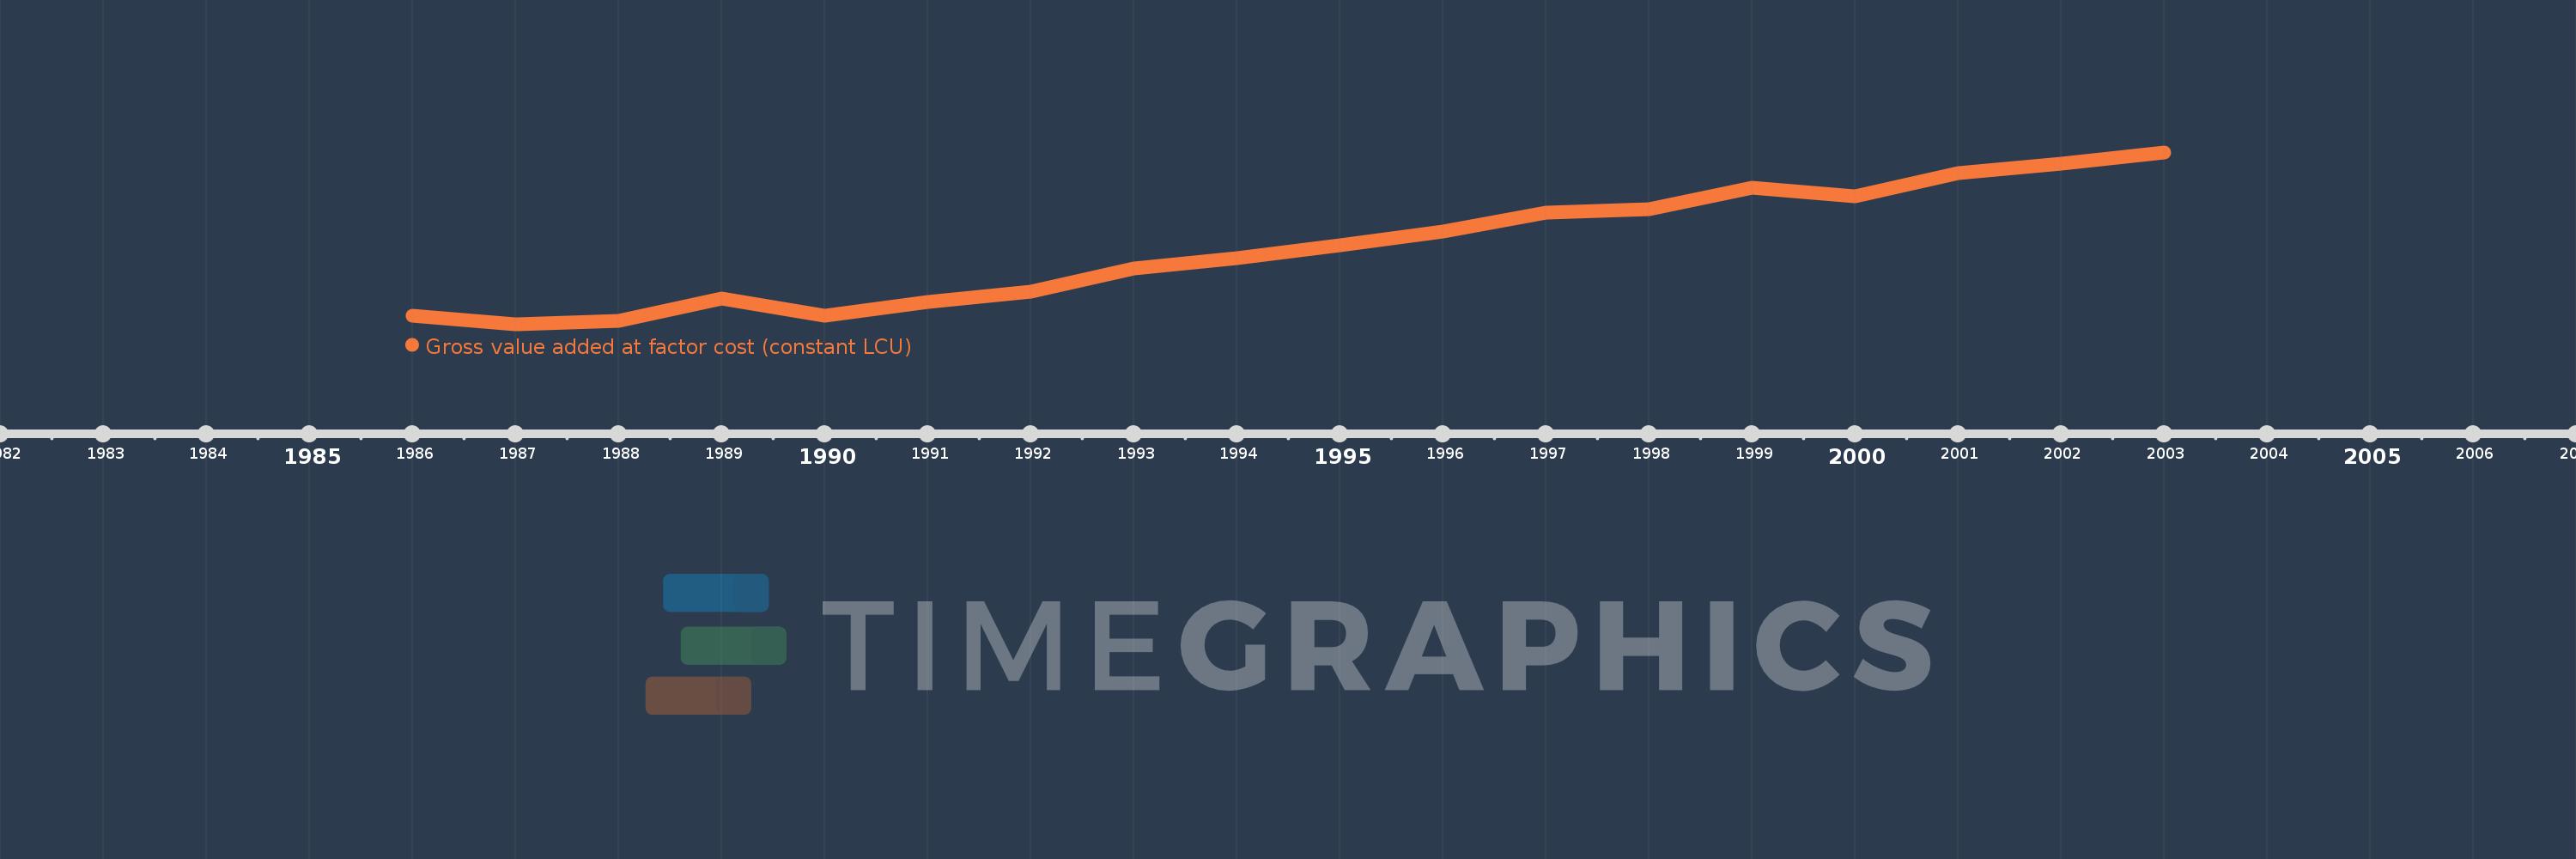
En esta escala de tiempo se presenta un gráfico de 1986 y 2003 de Syrian Arab Republic. Los datos de 1985 están ausentes. El número de observaciones reales por fecha: 18.
Fuente (nombre):
Indicadores del desarrollo mundial
Fuente (organización):
World Bank national accounts data, and OECD National Accounts data files.
Categorías:
Economy & Growth
Se ha actualizado:
23 abr 2017 año
Los indicadores de los cambios de valor en los últimos años
En promedio:
717.641 bn
Mínimo:
494.482 bn
1 ene 1987 año
Máximo:
998.396 bn
1 ene 2003 año
A la fecha de observación
Valor
Cambio absoluto
El cambio con respecto al valor anterior
1 ene 1986 año
520.21 bn
+520.21 bn
0.0%
1 ene 1987 año
494.482 bn
-25.728 bn
-4.95%
1 ene 1988 año
503.914 bn
+9.432 bn
1.91%
1 ene 1989 año
570.765 bn
+66.851 bn
13.27%
1 ene 1990 año
519.635 bn
-51.13 bn
-8.96%
1 ene 1991 año
559.339 bn
+39.704 bn
7.64%
1 ene 1992 año
589.509 bn
+30.17 bn
5.39%
1 ene 1993 año
658.001 bn
+68.492 bn
11.62%
1 ene 1994 año
688.386 bn
+30.385 bn
4.62%
1 ene 1995 año
726.121 bn
+37.735 bn
5.48%
1 ene 1996 año
766.308 bn
+40.187 bn
5.53%
1 ene 1997 año
821.238 bn
+54.931 bn
7.17%
1 ene 1998 año
832.199 bn
+10.96 bn
1.33%
1 ene 1999 año
893.86 bn
+61.661 bn
7.41%
1 ene 2000 año
870.292 bn
-23.568 bn
-2.64%
1 ene 2001 año
938.458 bn
+68.166 bn
7.83%
1 ene 2002 año
966.433 bn
+27.975 bn
2.98%
1 ene 2003 año
998.396 bn
+31.963 bn
3.31%
Ranking de los países por los datos estadísticos actuales

Comentarios:

Enviar
PremiumAbout & FeedbackAcuerdoPrivacidad
logo
© 2022 Selected Technologies LLC – Morgan Hill, California