29
/es/
es
AIzaSyAYiBZKx7MnpbEhh9jyipgxe19OcubqV5w
April 1, 2024
114883
Croatia
HRV
true
2
1
Gross value added at factor cost (constant LCU)
2016,2015,2014,2013,2012,2011,2010,2009,2008,2007,2006,2005,2004,2003,2002,2001,2000,1999,1998,1997,1996
Download
Estadísticas Globales de la Biblioteca →Croatia →

Gross value added at factor cost (constant LCU)

Estas estadísticas en otros países:
AfghanistanAlbaniaAlgeriaAntigua and BarbudaArgentinaArmeniaAustraliaAustriaAzerbaijanBahamas, TheBangladeshBelarusBelgiumBelizeBeninBermudaBhutanBoliviaBosnia and HerzegovinaBotswanaBrazilBulgariaBurkina FasoBurundiCabo VerdeCambodiaCameroonCanadaCayman IslandsCentral African RepublicChadChileColombiaCongo, Dem. Rep.Costa RicaCote d'IvoireCroatiaCubaCyprusCzech RepublicDenmarkDjiboutiDominicaDominican RepublicEcuadorEgypt, Arab Rep.El SalvadorEquatorial GuineaEritreaEstoniaEthiopiaFijiFinlandFranceGabonGambia, TheGeorgiaGermanyGhanaGreeceGrenadaGuatemalaGuineaGuinea-BissauGuyanaHaitiHondurasHong Kong SAR, ChinaHungaryIcelandIndiaIndonesiaIran, Islamic Rep.IrelandItalyJamaicaJapanJordanKazakhstanKenyaKiribatiKorea, Rep.KosovoKuwaitKyrgyz RepublicLao PDRLatviaLebanonLesothoLiberiaLithuaniaLuxembourgMacedonia, FYRMadagascarMalawiMaldivesMaliMarshall IslandsMauritaniaMauritiusMexicoMicronesia, Fed. Sts.MoldovaMongoliaMontenegroMoroccoMozambiqueNamibiaNepalNetherlandsNew ZealandNicaraguaNigeriaNorwayOmanPakistanPalauPanamaPapua New GuineaParaguayPeruPhilippinesPolandPortugalRomaniaRussian FederationRwandaSao Tome and PrincipeSenegalSerbiaSeychellesSierra LeoneSingaporeSlovak RepublicSloveniaSolomon IslandsSomaliaSouth AfricaSpainSri LankaSt. Kitts and NevisSt. LuciaSt. Vincent and the GrenadinesSudanSurinameSwazilandSwedenSwitzerlandSyrian Arab RepublicTajikistanTanzaniaThailandTimor-LesteTongaTrinidad and TobagoTunisiaTurkeyTurkmenistanTuvaluUgandaUkraineUnited Arab EmiratesUnited KingdomUnited StatesUruguayUzbekistanVanuatuVenezuela, RBVietnamWest Bank and GazaZambiaZimbabwe
línea de tiempo (timeline):
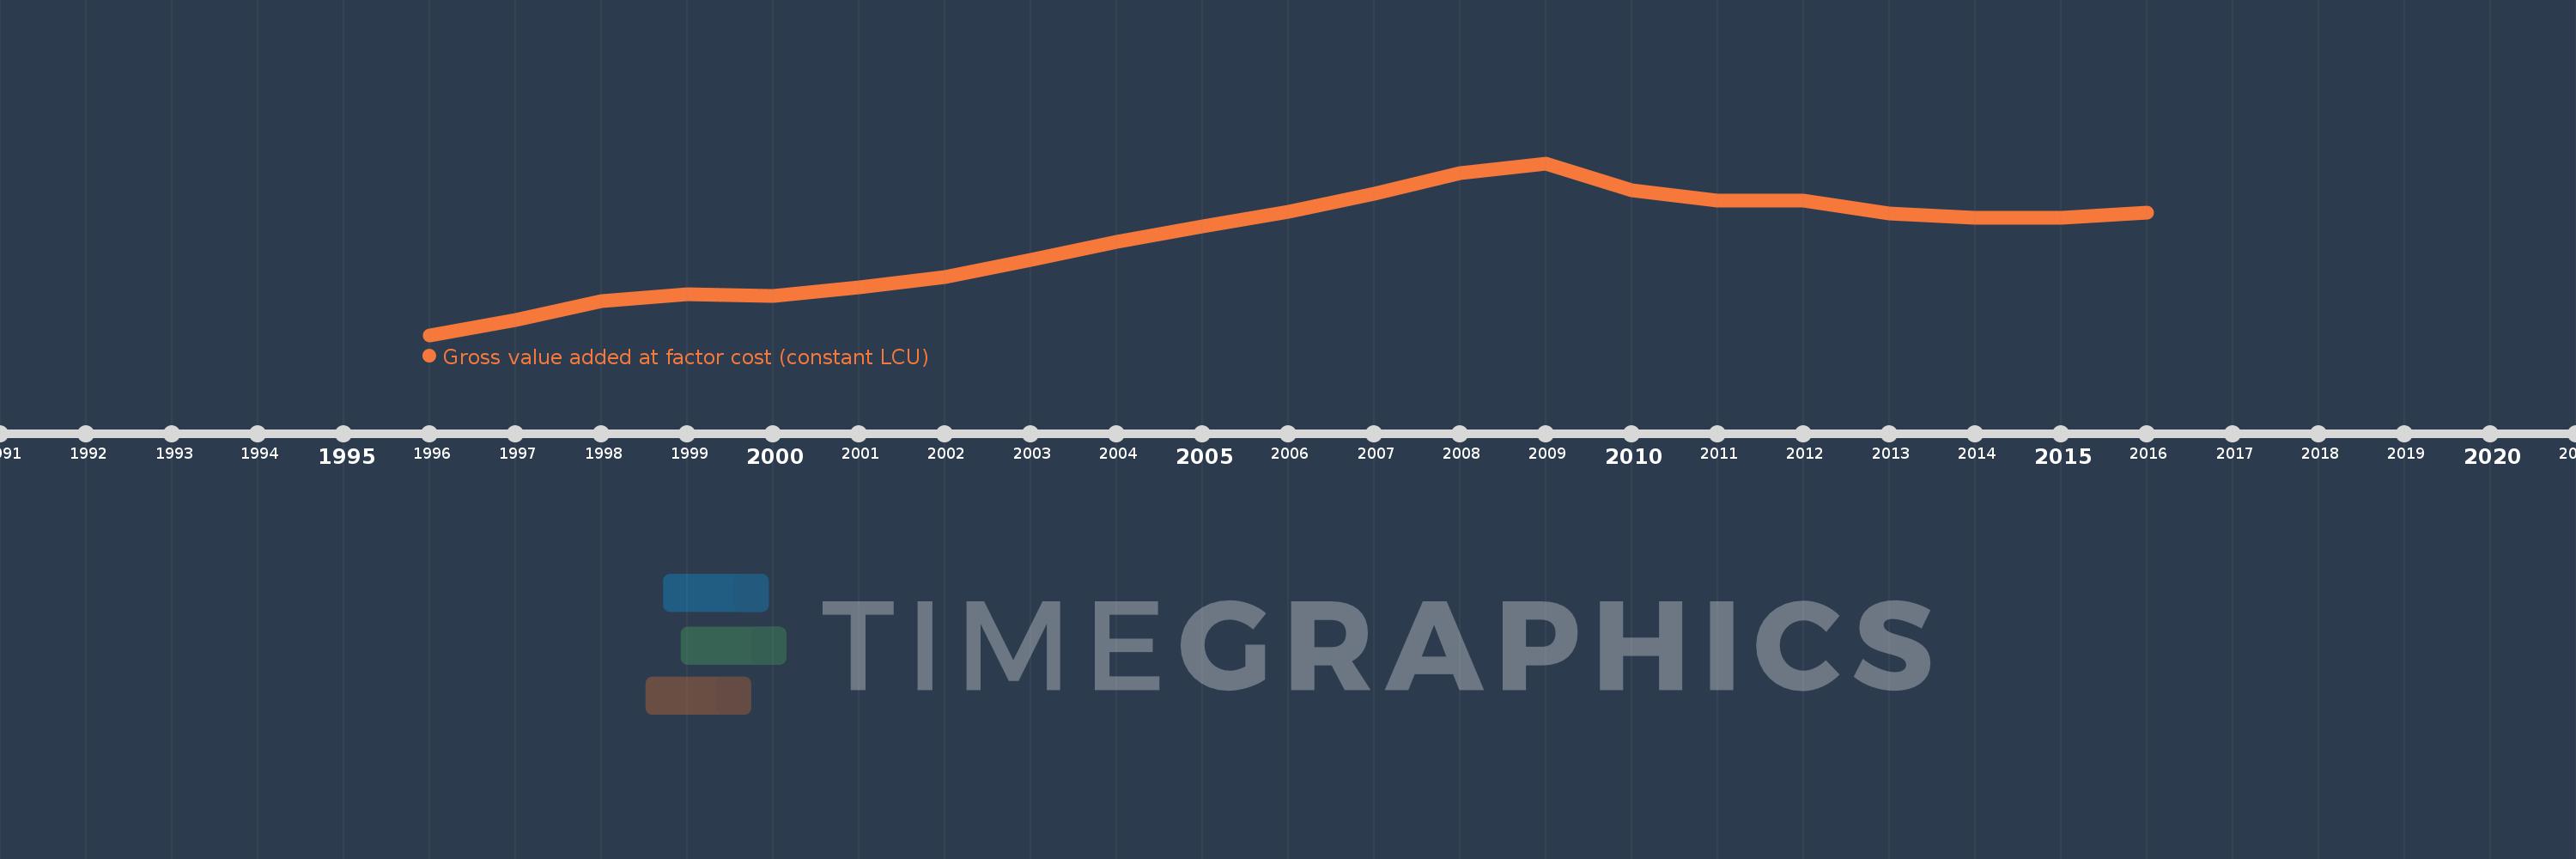
En esta escala de tiempo se presenta un gráfico de 1996 y 2016 de Croatia. Los datos de 1995 están ausentes. El número de observaciones reales por fecha: 21.
Fuente (nombre):
Indicadores del desarrollo mundial
Fuente (organización):
World Bank national accounts data, and OECD National Accounts data files.
Categorías:
Economy & Growth
Se ha actualizado:
23 abr 2017 año
Los indicadores de los cambios de valor en los últimos años
En promedio:
252.655 bn
Mínimo:
184.838 bn
1 ene 1996 año
Máximo:
306.984 bn
1 ene 2009 año
A la fecha de observación
Valor
Cambio absoluto
El cambio con respecto al valor anterior
1 ene 1996 año
184.838 bn
+184.838 bn
0.0%
1 ene 1997 año
195.727 bn
+10.889 bn
5.89%
1 ene 1998 año
209.101 bn
+13.374 bn
6.83%
1 ene 1999 año
214.062 bn
+4.962 bn
2.37%
1 ene 2000 año
212.825 bn
-1.238 bn
-0.58%
1 ene 2001 año
218.581 bn
+5.756 bn
2.7%
1 ene 2002 año
226.295 bn
+7.714 bn
3.53%
1 ene 2003 año
237.973 bn
+11.678 bn
5.16%
1 ene 2004 año
251.245 bn
+13.271 bn
5.58%
1 ene 2005 año
261.969 bn
+10.724 bn
4.27%
1 ene 2006 año
272.495 bn
+10.526 bn
4.02%
1 ene 2007 año
285.433 bn
+12.938 bn
4.75%
1 ene 2008 año
299.779 bn
+14.346 bn
5.03%
1 ene 2009 año
306.984 bn
+7.205 bn
2.4%
1 ene 2010 año
287.631 bn
-19.353 bn
-6.3%
1 ene 2011 año
280.465 bn
-7.166 bn
-2.49%
1 ene 2012 año
280.39 bn
-75.072 millones
-0.03%
1 ene 2013 año
271.46 bn
-8.93 bn
-3.18%
1 ene 2014 año
268.459 bn
-3.001 bn
-1.11%
1 ene 2015 año
268.155 bn
-304.113 millones
-0.11%
1 ene 2016 año
271.885 bn
+3.73 bn
1.39%
Ranking de los países por los datos estadísticos actuales

Comentarios:

Enviar
PremiumAbout & FeedbackAcuerdoPrivacidad
logo
© 2022 Selected Technologies LLC – Morgan Hill, California