29
/es/
es
AIzaSyAYiBZKx7MnpbEhh9jyipgxe19OcubqV5w
April 1, 2024
159488
Ireland
IRL
true
2
1
Gross value added at factor cost (constant LCU)
2016,2015,2014,2013,2012,2011,2010,2009,2008,2007,2006,2005,2004,2003,2002,2001,2000,1999,1998,1997,1996
Download
Estadísticas Globales de la Biblioteca →Ireland →

Gross value added at factor cost (constant LCU)

Estas estadísticas en otros países:
AfghanistanAlbaniaAlgeriaAntigua and BarbudaArgentinaArmeniaAustraliaAustriaAzerbaijanBahamas, TheBangladeshBelarusBelgiumBelizeBeninBermudaBhutanBoliviaBosnia and HerzegovinaBotswanaBrazilBulgariaBurkina FasoBurundiCabo VerdeCambodiaCameroonCanadaCayman IslandsCentral African RepublicChadChileColombiaCongo, Dem. Rep.Costa RicaCote d'IvoireCroatiaCubaCyprusCzech RepublicDenmarkDjiboutiDominicaDominican RepublicEcuadorEgypt, Arab Rep.El SalvadorEquatorial GuineaEritreaEstoniaEthiopiaFijiFinlandFranceGabonGambia, TheGeorgiaGermanyGhanaGreeceGrenadaGuatemalaGuineaGuinea-BissauGuyanaHaitiHondurasHong Kong SAR, ChinaHungaryIcelandIndiaIndonesiaIran, Islamic Rep.IrelandItalyJamaicaJapanJordanKazakhstanKenyaKiribatiKorea, Rep.KosovoKuwaitKyrgyz RepublicLao PDRLatviaLebanonLesothoLiberiaLithuaniaLuxembourgMacedonia, FYRMadagascarMalawiMaldivesMaliMarshall IslandsMauritaniaMauritiusMexicoMicronesia, Fed. Sts.MoldovaMongoliaMontenegroMoroccoMozambiqueNamibiaNepalNetherlandsNew ZealandNicaraguaNigeriaNorwayOmanPakistanPalauPanamaPapua New GuineaParaguayPeruPhilippinesPolandPortugalRomaniaRussian FederationRwandaSao Tome and PrincipeSenegalSerbiaSeychellesSierra LeoneSingaporeSlovak RepublicSloveniaSolomon IslandsSomaliaSouth AfricaSpainSri LankaSt. Kitts and NevisSt. LuciaSt. Vincent and the GrenadinesSudanSurinameSwazilandSwedenSwitzerlandSyrian Arab RepublicTajikistanTanzaniaThailandTimor-LesteTongaTrinidad and TobagoTunisiaTurkeyTurkmenistanTuvaluUgandaUkraineUnited Arab EmiratesUnited KingdomUnited StatesUruguayUzbekistanVanuatuVenezuela, RBVietnamWest Bank and GazaZambiaZimbabwe
línea de tiempo (timeline):
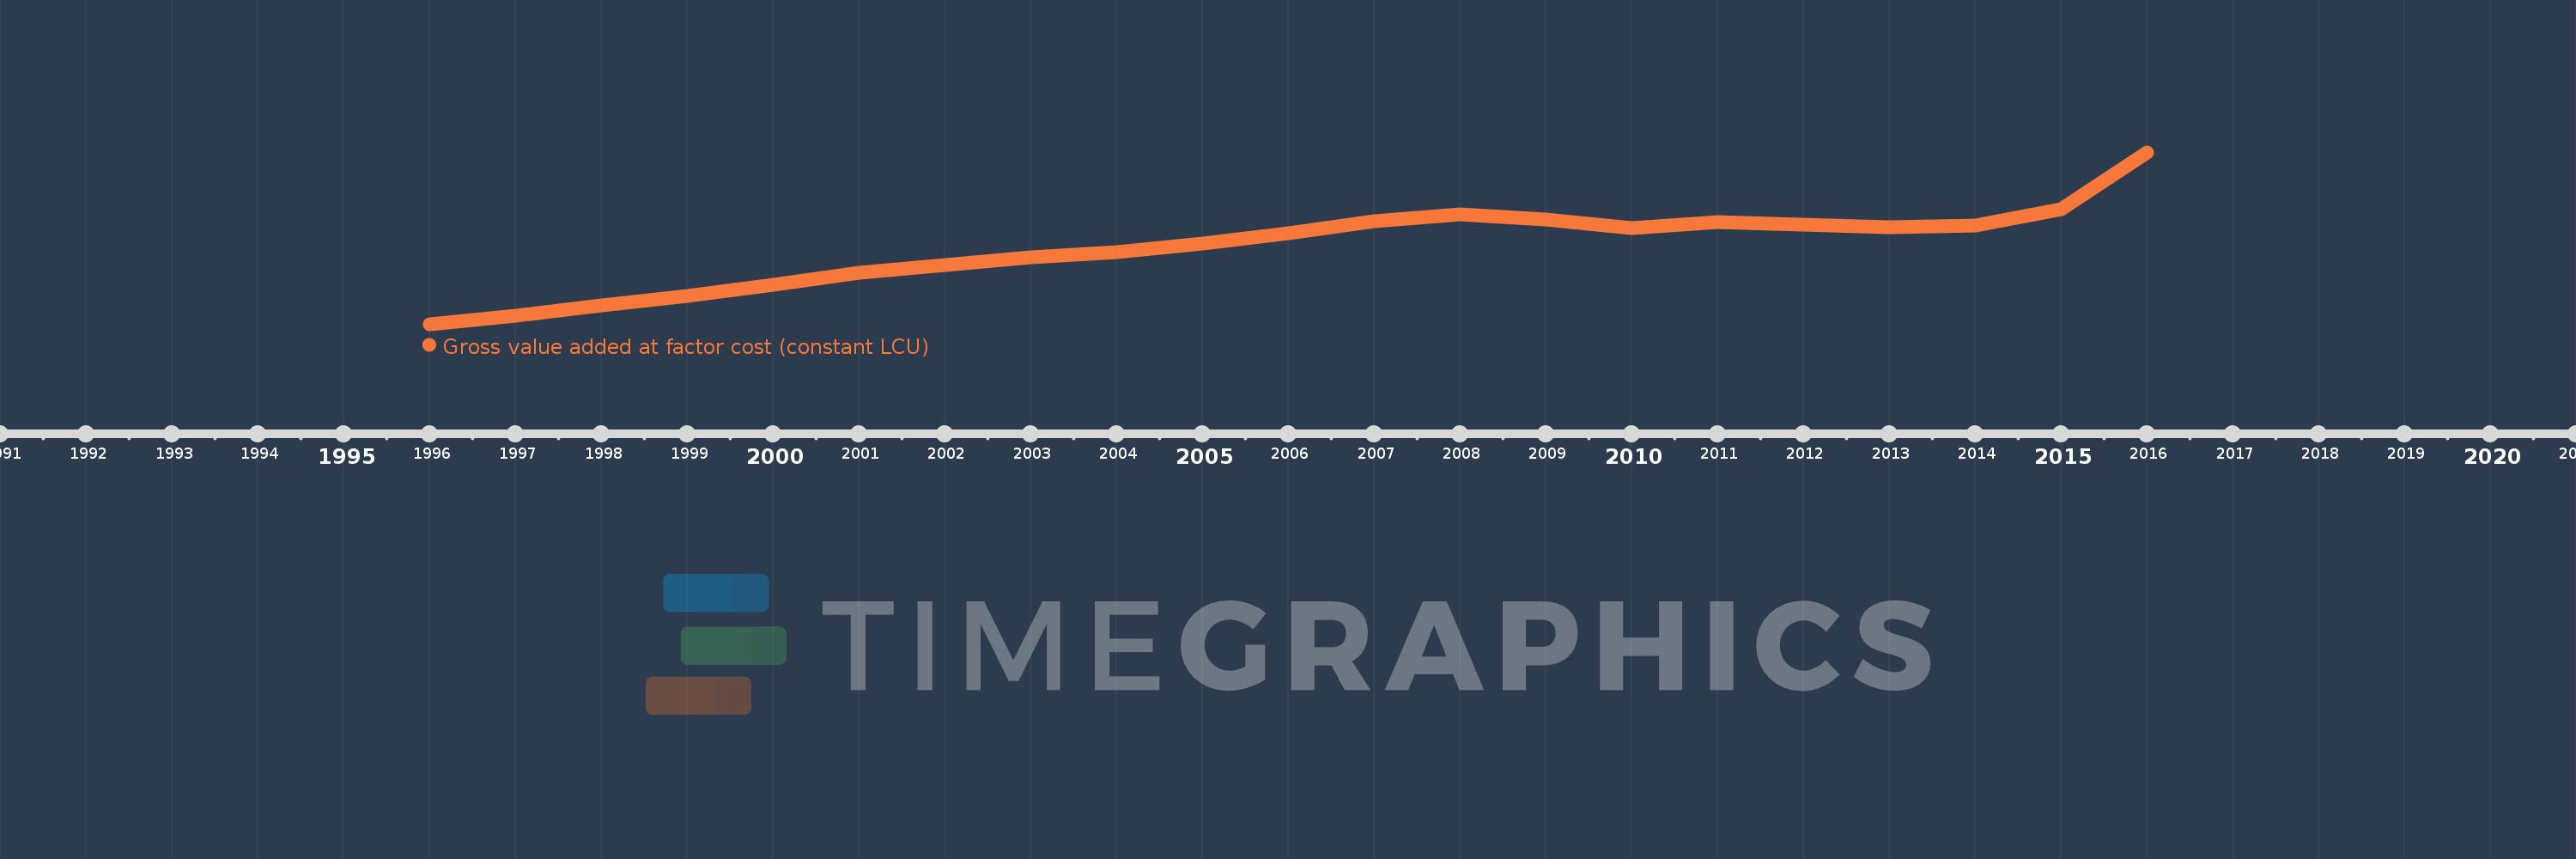
En esta escala de tiempo se presenta un gráfico de 1996 y 2016 de Ireland. Los datos de 1995 están ausentes. El número de observaciones reales por fecha: 21.
Fuente (nombre):
Indicadores del desarrollo mundial
Fuente (organización):
World Bank national accounts data, and OECD National Accounts data files.
Categorías:
Economy & Growth
Se ha actualizado:
23 abr 2017 año
Los indicadores de los cambios de valor en los últimos años
En promedio:
132.051 bn
Mínimo:
70.934 bn
1 ene 1996 año
Máximo:
207.658 bn
1 ene 2016 año
A la fecha de observación
Valor
Cambio absoluto
El cambio con respecto al valor anterior
1 ene 1996 año
70.934 bn
+70.934 bn
0.0%
1 ene 1997 año
77.628 bn
+6.694 bn
9.44%
1 ene 1998 año
86.151 bn
+8.523 bn
10.98%
1 ene 1999 año
93.224 bn
+7.073 bn
8.21%
1 ene 2000 año
102.138 bn
+8.913 bn
9.56%
1 ene 2001 año
111.578 bn
+9.441 bn
9.24%
1 ene 2002 año
117.698 bn
+6.12 bn
5.48%
1 ene 2003 año
124.367 bn
+6.669 bn
5.67%
1 ene 2004 año
128.039 bn
+3.672 bn
2.95%
1 ene 2005 año
135.202 bn
+7.163 bn
5.59%
1 ene 2006 año
143.58 bn
+8.377 bn
6.2%
1 ene 2007 año
152.74 bn
+9.161 bn
6.38%
1 ene 2008 año
158.479 bn
+5.739 bn
3.76%
1 ene 2009 año
154.261 bn
-4.218 bn
-2.66%
1 ene 2010 año
147.184 bn
-7.078 bn
-4.59%
1 ene 2011 año
151.884 bn
+4.701 bn
3.19%
1 ene 2012 año
149.928 bn
-1.957 bn
-1.29%
1 ene 2013 año
147.99 bn
-1.938 bn
-1.29%
1 ene 2014 año
149.761 bn
+1.771 bn
1.2%
1 ene 2015 año
162.643 bn
+12.882 bn
8.6%
1 ene 2016 año
207.658 bn
+45.015 bn
27.68%
Ranking de los países por los datos estadísticos actuales

Comentarios:

Enviar
PremiumAbout & FeedbackAcuerdoPrivacidad
logo
© 2022 Selected Technologies LLC – Morgan Hill, California