29
/es/
es
AIzaSyAYiBZKx7MnpbEhh9jyipgxe19OcubqV5w
April 1, 2024
258002
Syrian Arab Republic
SYR
true
2
1
Agriculture, value added (current LCU)
2008,2007,2006,2005,2004,2003,2002,2001,2000,1999,1998,1997,1996,1995,1994,1993,1992,1991,1990,1989,1988,1987,1986
Download
Estadísticas Globales de la Biblioteca →Syrian Arab Republic →

Agriculture, value added (current LCU)

Estas estadísticas en otros países:
AfghanistanAlbaniaAlgeriaAndorraAngolaAntigua and BarbudaArgentinaArmeniaArubaAustraliaAustriaAzerbaijanBahamas, TheBahrainBangladeshBarbadosBelarusBelgiumBelizeBeninBermudaBhutanBoliviaBosnia and HerzegovinaBotswanaBrazilBrunei DarussalamBulgariaBurkina FasoBurundiCabo VerdeCambodiaCameroonCanadaCayman IslandsCentral African RepublicChadChileChinaColombiaComorosCongo, Dem. Rep.Congo, Rep.Costa RicaCote d'IvoireCroatiaCubaCyprusCzech RepublicDenmarkDjiboutiDominicaDominican RepublicEcuadorEgypt, Arab Rep.El SalvadorEquatorial GuineaEritreaEstoniaEthiopiaFijiFinlandFranceFrench PolynesiaGabonGambia, TheGeorgiaGermanyGhanaGreeceGrenadaGuatemalaGuineaGuinea-BissauGuyanaHondurasHong Kong SAR, ChinaHungaryIcelandIndiaIndonesiaIran, Islamic Rep.IraqIrelandItalyJamaicaJapanJordanKazakhstanKenyaKiribatiKorea, Rep.KosovoKuwaitKyrgyz RepublicLao PDRLatviaLebanonLesothoLiberiaLibyaLithuaniaLuxembourgMacao SAR, ChinaMacedonia, FYRMadagascarMalawiMalaysiaMaldivesMaliMaltaMarshall IslandsMauritaniaMauritiusMexicoMicronesia, Fed. Sts.MoldovaMongoliaMontenegroMoroccoMozambiqueMyanmarNamibiaNepalNetherlandsNew CaledoniaNew ZealandNicaraguaNigerNigeriaNorwayOmanPakistanPalauPanamaPapua New GuineaParaguayPeruPhilippinesPolandPortugalPuerto RicoQatarRomaniaRussian FederationRwandaSamoaSao Tome and PrincipeSaudi ArabiaSenegalSerbiaSeychellesSierra LeoneSingaporeSlovak RepublicSloveniaSolomon IslandsSomaliaSouth AfricaSpainSri LankaSt. Kitts and NevisSt. LuciaSt. Vincent and the GrenadinesSudanSurinameSwazilandSwedenSwitzerlandSyrian Arab RepublicTajikistanTanzaniaThailandTimor-LesteTogoTongaTrinidad and TobagoTunisiaTurkeyTurkmenistanTuvaluUgandaUkraineUnited Arab EmiratesUnited KingdomUnited StatesUruguayUzbekistanVanuatuVenezuela, RBVietnamWest Bank and GazaYemen, Rep.ZambiaZimbabwe
línea de tiempo (timeline):
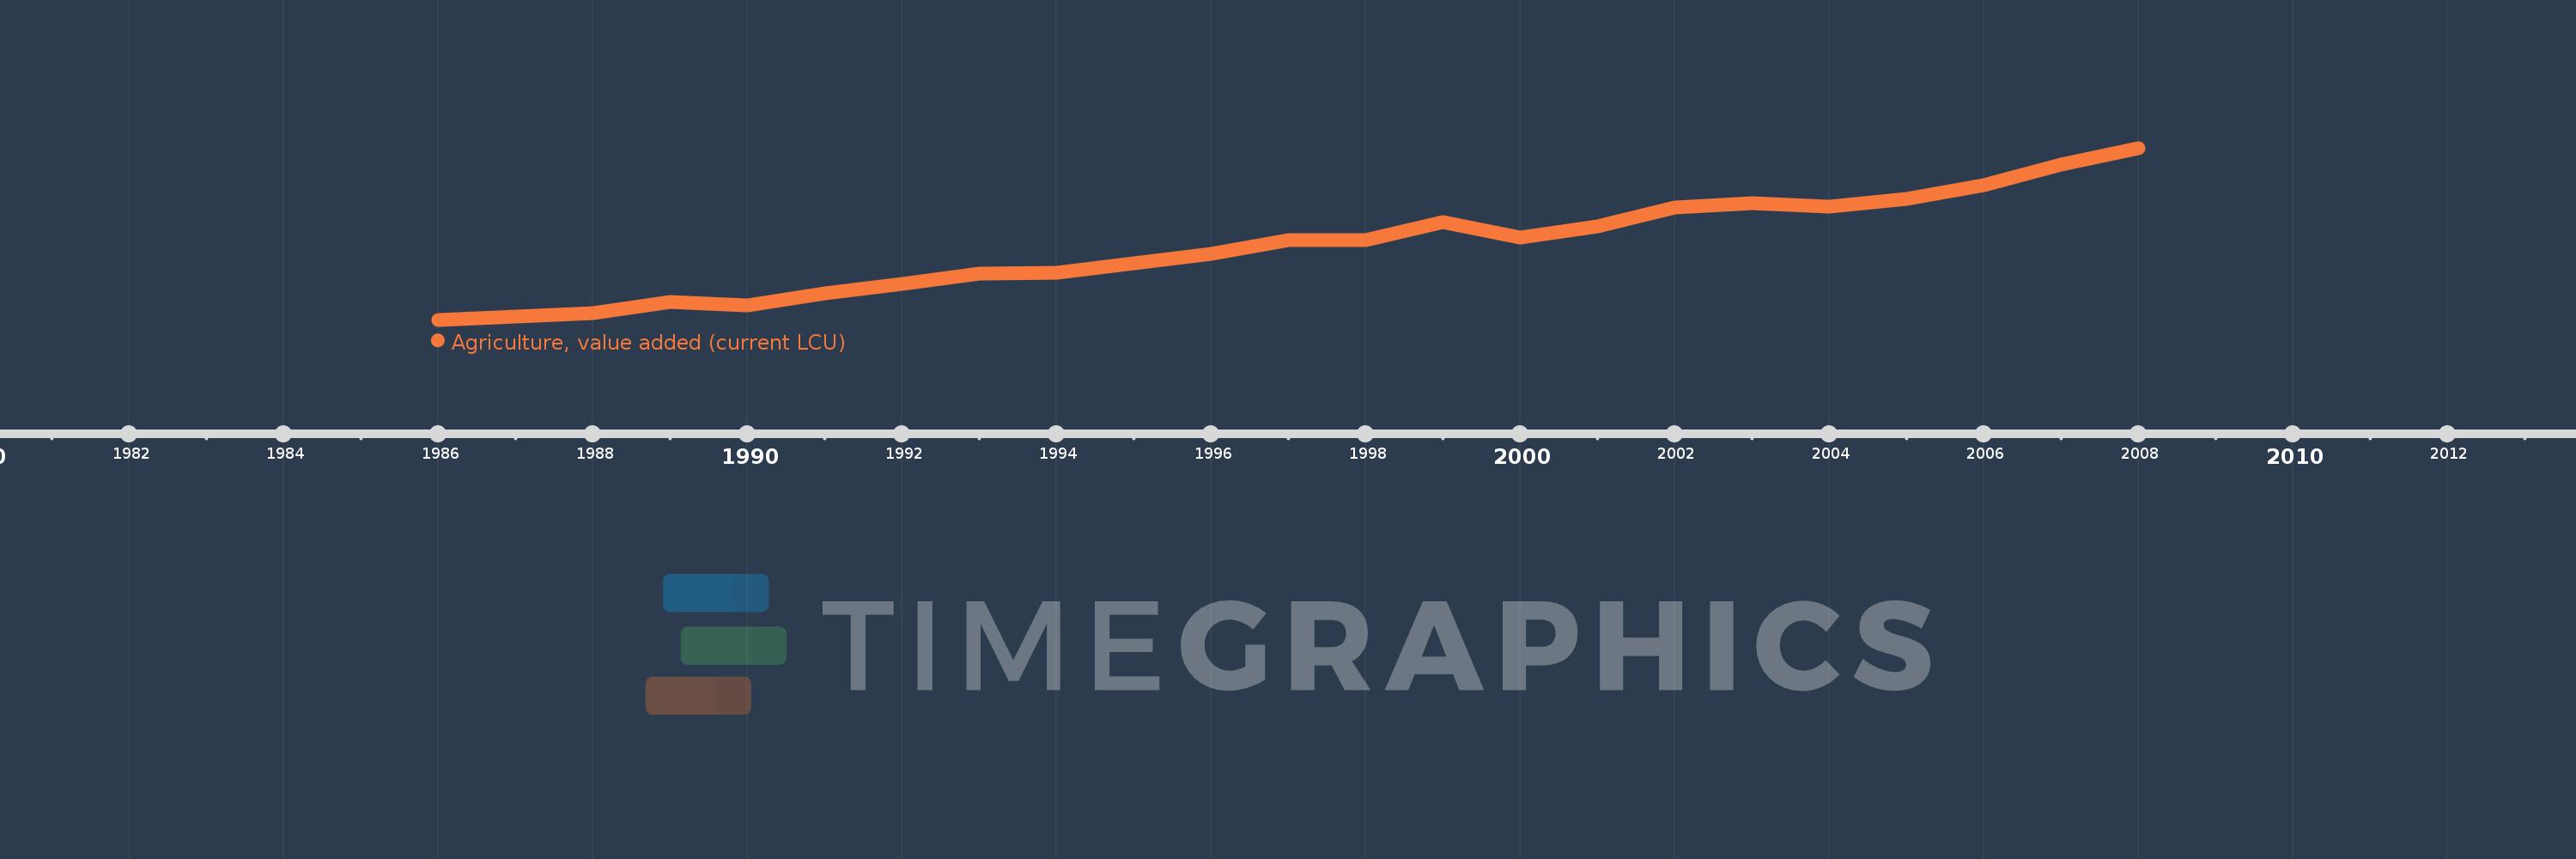
En esta escala de tiempo se presenta un gráfico de 1986 y 2008 de Syrian Arab Republic. Los datos de 1985 están ausentes. El número de observaciones reales por fecha: 23.
Fuente (nombre):
Indicadores del desarrollo mundial
Fuente (organización):
World Bank national accounts data, and OECD National Accounts data files.
Categorías:
Economy & Growth
Se ha actualizado:
23 abr 2017 año
Los indicadores de los cambios de valor en los últimos años
En promedio:
177.116 bn
Mínimo:
17.322 bn
1 ene 1986 año
Máximo:
394.22 bn
1 ene 2008 año
A la fecha de observación
Valor
Cambio absoluto
El cambio con respecto al valor anterior
1 ene 1986 año
17.322 bn
+17.322 bn
0.0%
1 ene 1987 año
23.624 bn
+6.302 bn
36.38%
1 ene 1988 año
32.217 bn
+8.593 bn
36.37%
1 ene 1989 año
56.119 bn
+23.902 bn
74.19%
1 ene 1990 año
49.148 bn
-6.97 bn
-12.42%
1 ene 1991 año
75.897 bn
+26.749 bn
54.42%
1 ene 1992 año
95.575 bn
+19.678 bn
25.93%
1 ene 1993 año
117.853 bn
+22.278 bn
23.31%
1 ene 1994 año
120.024 bn
+2.171 bn
1.84%
1 ene 1995 año
140.904 bn
+20.88 bn
17.4%
1 ene 1996 año
161.024 bn
+20.12 bn
14.28%
1 ene 1997 año
191.487 bn
+30.463 bn
18.92%
1 ene 1998 año
192.162 bn
+675.005 millones
0.35%
1 ene 1999 año
232.283 bn
+40.121 bn
20.88%
1 ene 2000 año
197.682 bn
-34.601 bn
-14.9%
1 ene 2001 año
222.886 bn
+25.204 bn
12.75%
1 ene 2002 año
262.78 bn
+39.894 bn
17.9%
1 ene 2003 año
272.879 bn
+10.099 bn
3.84%
1 ene 2004 año
265.251 bn
-7.628 bn
-2.8%
1 ene 2005 año
282.093 bn
+16.842 bn
6.35%
1 ene 2006 año
312.231 bn
+30.138 bn
10.68%
1 ene 2007 año
358.018 bn
+45.787 bn
14.66%
1 ene 2008 año
394.22 bn
+36.202 bn
10.11%
Ranking de los países por los datos estadísticos actuales

Comentarios:

Enviar
PremiumAbout & FeedbackAcuerdoPrivacidad
logo
© 2022 Selected Technologies LLC – Morgan Hill, California