30
/es/
AIzaSyAYiBZKx7MnpbEhh9jyipgxe19OcubqV5w
April 1, 2024
224553
Poland
POL
true
2
1
Agriculture, value added (current LCU)
2016,2015,2014,2013,2012,2011,2010,2009,2008,2007,2006,2005,2004,2003,2002,2001,2000,1999,1998,1997,1996
Download
Estadísticas Globales de la Biblioteca →Poland →

Agriculture, value added (current LCU)

Estas estadísticas en otros países:

AfghanistanAlbaniaAlgeriaAndorraAngolaAntigua and BarbudaArgentinaArmeniaArubaAustraliaAustriaAzerbaijanBahamas, TheBahrainBangladeshBarbadosBelarusBelgiumBelizeBeninBermudaBhutanBoliviaBosnia and HerzegovinaBotswanaBrazilBrunei DarussalamBulgariaBurkina FasoBurundiCabo VerdeCambodiaCameroonCanadaCayman IslandsCentral African RepublicChadChileChinaColombiaComorosCongo, Dem. Rep.Congo, Rep.Costa RicaCote d'IvoireCroatiaCubaCyprusCzech RepublicDenmarkDjiboutiDominicaDominican RepublicEcuadorEgypt, Arab Rep.El SalvadorEquatorial GuineaEritreaEstoniaEthiopiaFijiFinlandFranceFrench PolynesiaGabonGambia, TheGeorgiaGermanyGhanaGreeceGrenadaGuatemalaGuineaGuinea-BissauGuyanaHondurasHong Kong SAR, ChinaHungaryIcelandIndiaIndonesiaIran, Islamic Rep.IraqIrelandItalyJamaicaJapanJordanKazakhstanKenyaKiribatiKorea, Rep.KosovoKuwaitKyrgyz RepublicLao PDRLatviaLebanonLesothoLiberiaLibyaLithuaniaLuxembourgMacao SAR, ChinaMacedonia, FYRMadagascarMalawiMalaysiaMaldivesMaliMaltaMarshall IslandsMauritaniaMauritiusMexicoMicronesia, Fed. Sts.MoldovaMongoliaMontenegroMoroccoMozambiqueMyanmarNamibiaNepalNetherlandsNew CaledoniaNew ZealandNicaraguaNigerNigeriaNorwayOmanPakistanPalauPanamaPapua New GuineaParaguayPeruPhilippinesPolandPortugalPuerto RicoQatarRomaniaRussian FederationRwandaSamoaSao Tome and PrincipeSaudi ArabiaSenegalSerbiaSeychellesSierra LeoneSingaporeSlovak RepublicSloveniaSolomon IslandsSomaliaSouth AfricaSpainSri LankaSt. Kitts and NevisSt. LuciaSt. Vincent and the GrenadinesSudanSurinameSwazilandSwedenSwitzerlandSyrian Arab RepublicTajikistanTanzaniaThailandTimor-LesteTogoTongaTrinidad and TobagoTunisiaTurkeyTurkmenistanTuvaluUgandaUkraineUnited Arab EmiratesUnited KingdomUnited StatesUruguayUzbekistanVanuatuVenezuela, RBVietnamWest Bank and GazaYemen, Rep.ZambiaZimbabwe

línea de tiempo (timeline):

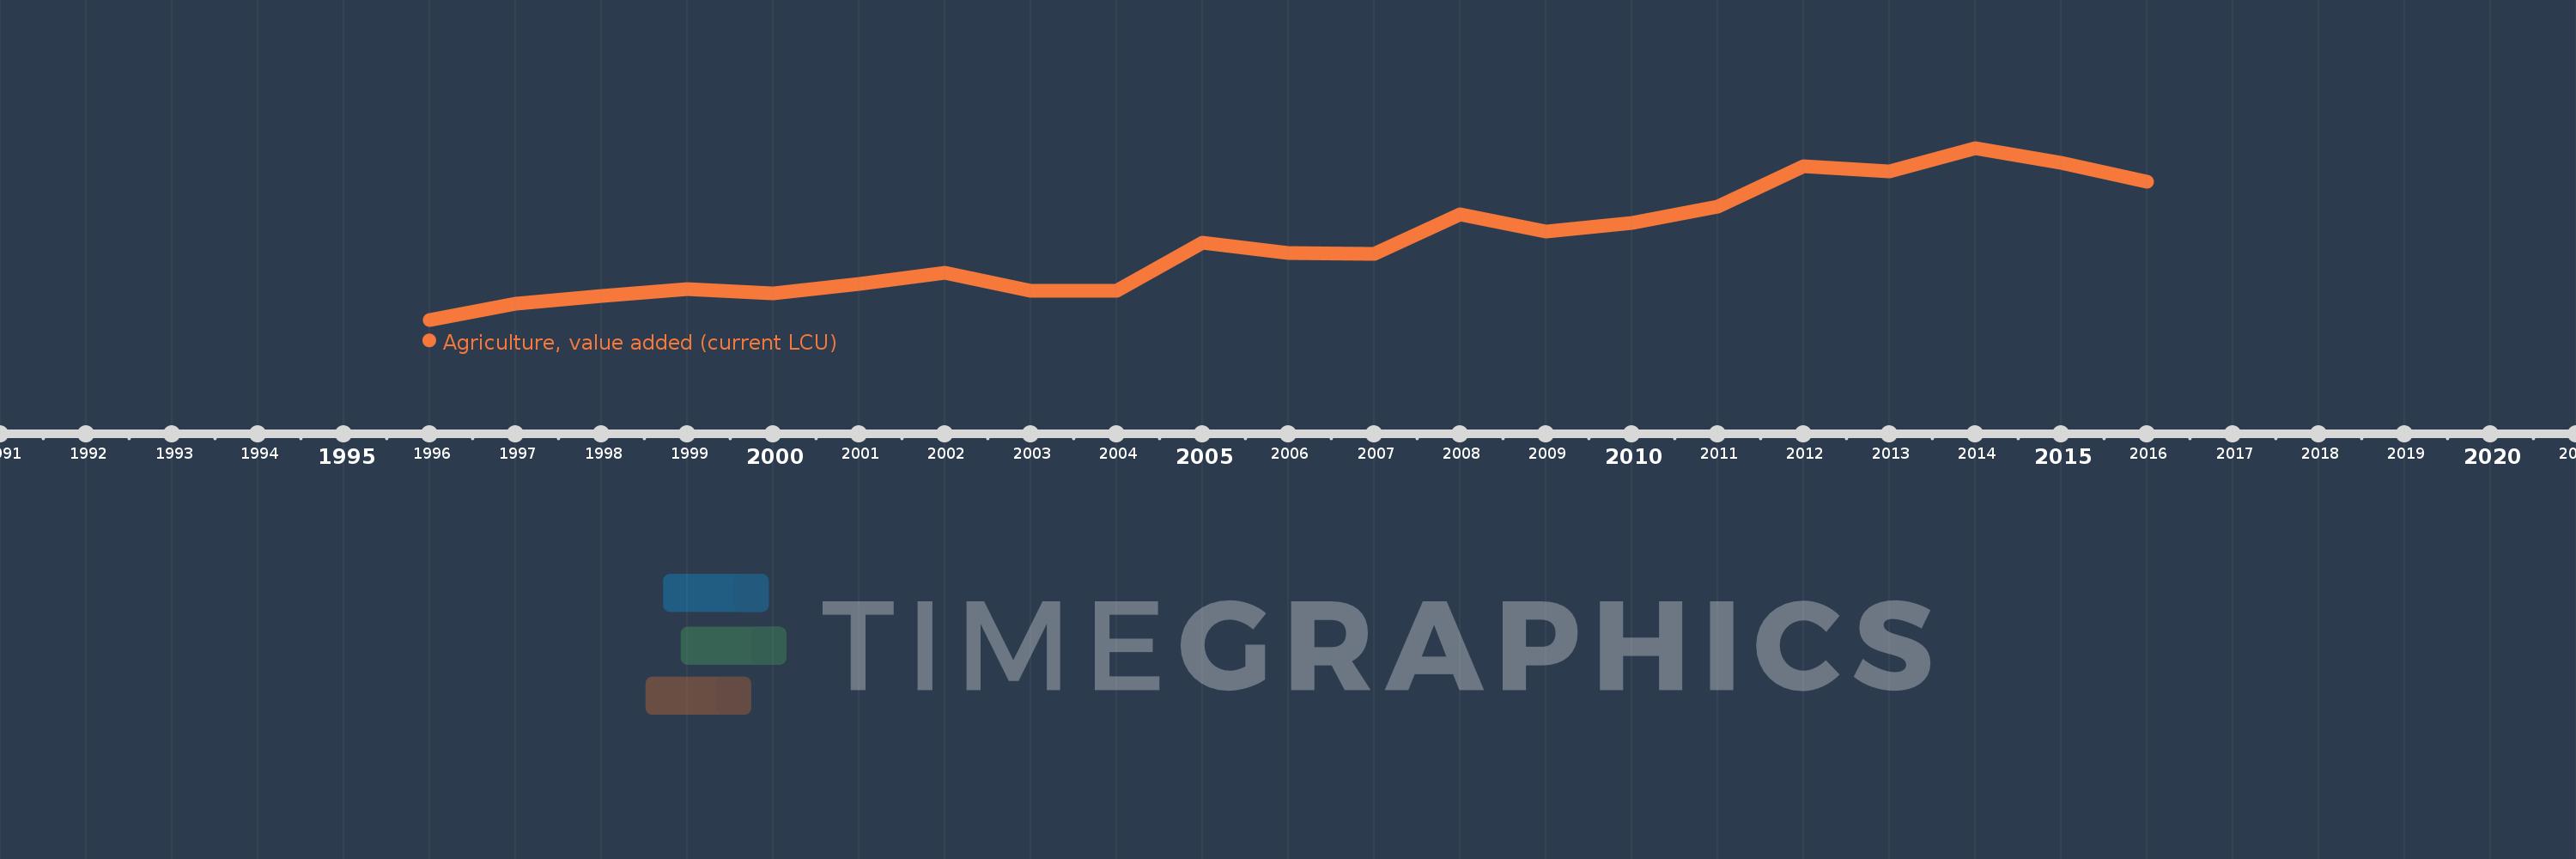
En esta escala de tiempo se presenta un gráfico de 1996 y 2016 de Poland. Los datos de 1995 están ausentes. El número de observaciones reales por fecha: 21.

Fuente (nombre):

Indicadores del desarrollo mundial

Fuente (organización):

World Bank national accounts data, and OECD National Accounts data files.

Categorías:

Economy & Growth

Se ha actualizado:

23 abr 2017 año

Los indicadores de los cambios de valor en los últimos años

En promedio:
30.551 bn
Mínimo:
16.622 bn
1 ene 1996 año
Máximo:
47.618 bn
1 ene 2014 año
A la fecha de observación
Valor
Cambio absoluto
El cambio con respecto al valor anterior
1 ene 1996 año
16.622 bn
+16.622 bn
0.0%
1 ene 1997 año
19.491 bn
+2.869 bn
17.26%
1 ene 1998 año
20.876 bn
+1.385 bn
7.11%
1 ene 1999 año
22.165 bn
+1.289 bn
6.17%
1 ene 2000 año
21.397 bn
-768.364 millones
-3.47%
1 ene 2001 año
23.113 bn
+1.716 bn
8.02%
1 ene 2002 año
25.122 bn
+2.009 bn
8.69%
1 ene 2003 año
21.839 bn
-3.283 bn
-13.07%
1 ene 2004 año
21.836 bn
-3.0 millones
-0.01%
1 ene 2005 año
30.479 bn
+8.643 bn
39.58%
1 ene 2006 año
28.703 bn
-1.776 bn
-5.83%
1 ene 2007 año
28.558 bn
-145.0 millones
-0.51%
1 ene 2008 año
35.705 bn
+7.147 bn
25.03%
1 ene 2009 año
32.614 bn
-3.091 bn
-8.66%
1 ene 2010 año
34.101 bn
+1.487 bn
4.56%
1 ene 2011 año
37.085 bn
+2.984 bn
8.75%
1 ene 2012 año
44.371 bn
+7.286 bn
19.65%
1 ene 2013 año
43.413 bn
-958.0 millones
-2.16%
1 ene 2014 año
47.618 bn
+4.205 bn
9.69%
1 ene 2015 año
44.939 bn
-2.679 bn
-5.63%
1 ene 2016 año
41.514 bn
-3.425 bn
-7.62%

Ranking de los países por los datos estadísticos actuales