29
/es/
es
AIzaSyAYiBZKx7MnpbEhh9jyipgxe19OcubqV5w
April 1, 2024
117621
Czech Republic
CZE
true
2
1
Agriculture, value added (current LCU)
2016,2015,2014,2013,2012,2011,2010,2009,2008,2007,2006,2005,2004,2003,2002,2001,2000,1999,1998,1997,1996,1995,1994
Download
Estadísticas Globales de la Biblioteca →Czech Republic →

Agriculture, value added (current LCU)

Estas estadísticas en otros países:
AfghanistanAlbaniaAlgeriaAndorraAngolaAntigua and BarbudaArgentinaArmeniaArubaAustraliaAustriaAzerbaijanBahamas, TheBahrainBangladeshBarbadosBelarusBelgiumBelizeBeninBermudaBhutanBoliviaBosnia and HerzegovinaBotswanaBrazilBrunei DarussalamBulgariaBurkina FasoBurundiCabo VerdeCambodiaCameroonCanadaCayman IslandsCentral African RepublicChadChileChinaColombiaComorosCongo, Dem. Rep.Congo, Rep.Costa RicaCote d'IvoireCroatiaCubaCyprusCzech RepublicDenmarkDjiboutiDominicaDominican RepublicEcuadorEgypt, Arab Rep.El SalvadorEquatorial GuineaEritreaEstoniaEthiopiaFijiFinlandFranceFrench PolynesiaGabonGambia, TheGeorgiaGermanyGhanaGreeceGrenadaGuatemalaGuineaGuinea-BissauGuyanaHondurasHong Kong SAR, ChinaHungaryIcelandIndiaIndonesiaIran, Islamic Rep.IraqIrelandItalyJamaicaJapanJordanKazakhstanKenyaKiribatiKorea, Rep.KosovoKuwaitKyrgyz RepublicLao PDRLatviaLebanonLesothoLiberiaLibyaLithuaniaLuxembourgMacao SAR, ChinaMacedonia, FYRMadagascarMalawiMalaysiaMaldivesMaliMaltaMarshall IslandsMauritaniaMauritiusMexicoMicronesia, Fed. Sts.MoldovaMongoliaMontenegroMoroccoMozambiqueMyanmarNamibiaNepalNetherlandsNew CaledoniaNew ZealandNicaraguaNigerNigeriaNorwayOmanPakistanPalauPanamaPapua New GuineaParaguayPeruPhilippinesPolandPortugalPuerto RicoQatarRomaniaRussian FederationRwandaSamoaSao Tome and PrincipeSaudi ArabiaSenegalSerbiaSeychellesSierra LeoneSingaporeSlovak RepublicSloveniaSolomon IslandsSomaliaSouth AfricaSpainSri LankaSt. Kitts and NevisSt. LuciaSt. Vincent and the GrenadinesSudanSurinameSwazilandSwedenSwitzerlandSyrian Arab RepublicTajikistanTanzaniaThailandTimor-LesteTogoTongaTrinidad and TobagoTunisiaTurkeyTurkmenistanTuvaluUgandaUkraineUnited Arab EmiratesUnited KingdomUnited StatesUruguayUzbekistanVanuatuVenezuela, RBVietnamWest Bank and GazaYemen, Rep.ZambiaZimbabwe
línea de tiempo (timeline):
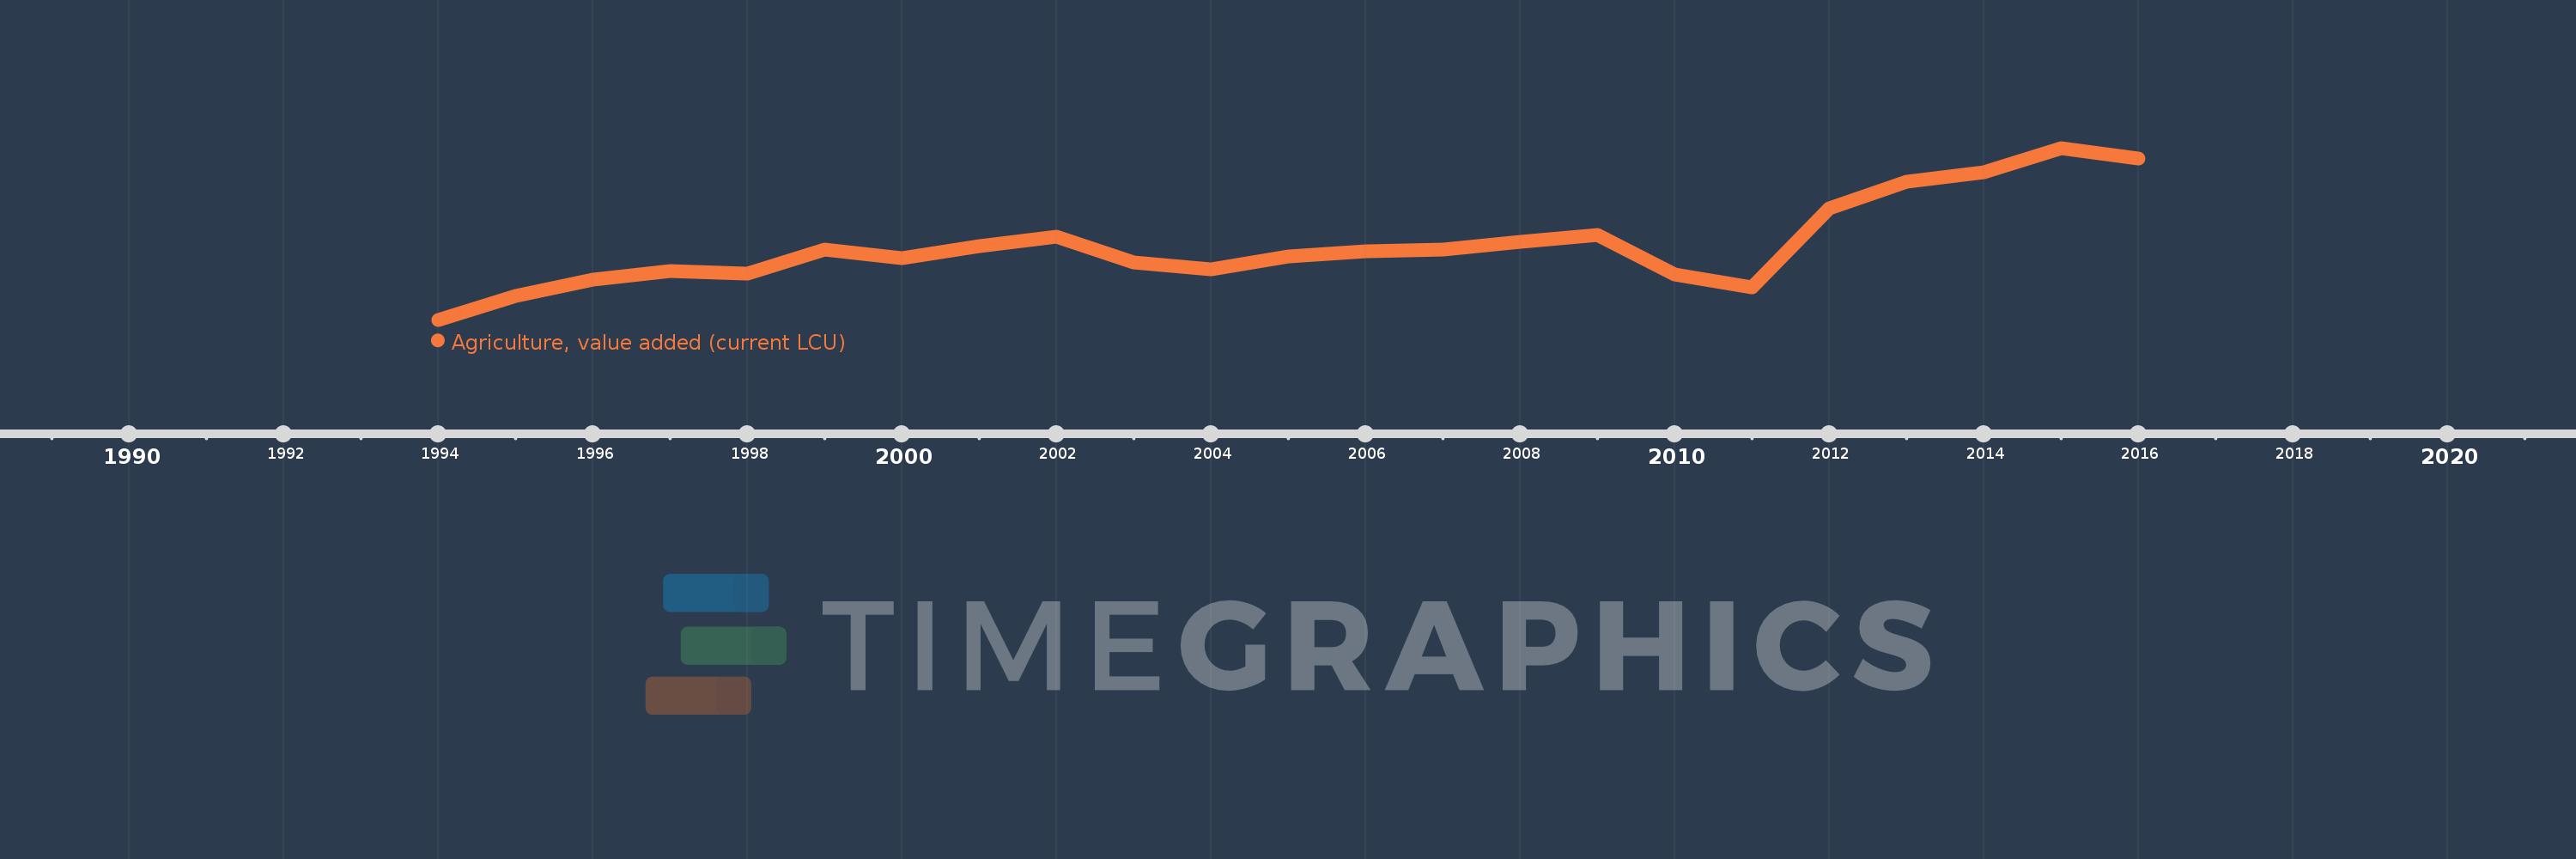
En esta escala de tiempo se presenta un gráfico de 1994 y 2016 de Czech Republic. Los datos de 1993 están ausentes. El número de observaciones reales por fecha: 23.
Fuente (nombre):
Indicadores del desarrollo mundial
Fuente (organización):
World Bank national accounts data, and OECD National Accounts data files.
Categorías:
Economy & Growth
Se ha actualizado:
23 abr 2017 año
Los indicadores de los cambios de valor en los últimos años
En promedio:
74.527 bn
Mínimo:
49.509 bn
1 ene 1994 año
Máximo:
106.72 bn
1 ene 2015 año
A la fecha de observación
Valor
Cambio absoluto
El cambio con respecto al valor anterior
1 ene 1994 año
49.509 bn
+49.509 bn
0.0%
1 ene 1995 año
57.471 bn
+7.962 bn
16.08%
1 ene 1996 año
62.908 bn
+5.437 bn
9.46%
1 ene 1997 año
65.838 bn
+2.93 bn
4.66%
1 ene 1998 año
64.963 bn
-875.0 millones
-1.33%
1 ene 1999 año
72.961 bn
+7.998 bn
12.31%
1 ene 2000 año
69.961 bn
-3.0 bn
-4.11%
1 ene 2001 año
74.111 bn
+4.15 bn
5.93%
1 ene 2002 año
77.22 bn
+3.109 bn
4.2%
1 ene 2003 año
68.731 bn
-8.489 bn
-10.99%
1 ene 2004 año
66.374 bn
-2.357 bn
-3.43%
1 ene 2005 año
70.609 bn
+4.235 bn
6.38%
1 ene 2006 año
72.19 bn
+1.581 bn
2.24%
1 ene 2007 año
72.821 bn
+631.0 millones
0.87%
1 ene 2008 año
75.389 bn
+2.568 bn
3.53%
1 ene 2009 año
77.8 bn
+2.411 bn
3.2%
1 ene 2010 año
64.525 bn
-13.275 bn
-17.06%
1 ene 2011 año
60.217 bn
-4.308 bn
-6.68%
1 ene 2012 año
86.632 bn
+26.415 bn
43.87%
1 ene 2013 año
95.396 bn
+8.764 bn
10.12%
1 ene 2014 año
98.504 bn
+3.108 bn
3.26%
1 ene 2015 año
106.72 bn
+8.216 bn
8.34%
1 ene 2016 año
103.269 bn
-3.451 bn
-3.23%
Ranking de los países por los datos estadísticos actuales

Comentarios:

Enviar
PremiumAbout & FeedbackAcuerdoPrivacidad
logo
© 2022 Selected Technologies LLC – Morgan Hill, California