33
/es/
AIzaSyAYiBZKx7MnpbEhh9jyipgxe19OcubqV5w
August 1, 2025
255196
Swaziland
SWZ
true
2
1
GNI growth (annual %)
2015,2014,2013,2012,2011,2010,2009,2008,2007,2006,2005,2004,2003,2002,2001,2000,1999,1998,1997,1996,1995,1994,1993,1992,1975,1974,1973,1972
Download
Estadísticas Globales de la Biblioteca →Swaziland →

GNI growth (annual %)

Estas estadísticas en otros países:

AlbaniaAlgeriaAngolaAntigua and BarbudaArab WorldArgentinaArmeniaAustraliaAustriaAzerbaijanBahamas, TheBahrainBangladeshBarbadosBelarusBelgiumBelizeBeninBhutanBoliviaBosnia and HerzegovinaBotswanaBrazilBrunei DarussalamBulgariaBurkina FasoBurundiCabo VerdeCambodiaCameroonCanadaCaribbean small statesCentral Europe and the BalticsChadChileChinaColombiaComorosCongo, Dem. Rep.Congo, Rep.Costa RicaCote d'IvoireCroatiaCubaCyprusCzech RepublicDenmarkDjiboutiDominican RepublicEarly-demographic dividendEast Asia & PacificEast Asia & Pacific (excluding high income)East Asia & Pacific (IDA & IBRD countries)EcuadorEgypt, Arab Rep.El SalvadorEquatorial GuineaEritreaEstoniaEthiopiaEuro areaEurope & Central AsiaEurope & Central Asia (excluding high income)Europe & Central Asia (IDA & IBRD countries)European UnionFijiFinlandFranceGabonGambia, TheGeorgiaGermanyGhanaGreeceGuatemalaGuineaGuinea-BissauHaitiHeavily indebted poor countries (HIPC)High incomeHondurasHong Kong SAR, ChinaHungaryIBRD onlyIcelandIDA & IBRD totalIDA blendIDA onlyIDA totalIndiaIndonesiaIran, Islamic Rep.IrelandIsraelItalyJamaicaJapanJordanKazakhstanKenyaKorea, Rep.KosovoKuwaitKyrgyz RepublicLao PDRLate-demographic dividendLatin America & Caribbean Latin America & Caribbean (excluding high income)Latin America & the Caribbean (IDA & IBRD countries)LatviaLeast developed countries: UN classificationLebanonLiberiaLibyaLithuaniaLow & middle incomeLow incomeLower middle incomeLuxembourgMacao SAR, ChinaMacedonia, FYRMadagascarMalawiMalaysiaMaliMaltaMauritaniaMauritiusMexicoMiddle East & North AfricaMiddle East & North Africa (excluding high income)Middle East & North Africa (IDA & IBRD countries)Middle incomeMoldovaMongoliaMontenegroMoroccoMozambiqueMyanmarNamibiaNepalNetherlandsNew ZealandNicaraguaNigerNigeriaNorth AmericaNorwayOECD membersOmanOther small statesPakistanPanamaPapua New GuineaParaguayPeruPhilippinesPolandPortugalPost-demographic dividendPre-demographic dividendPuerto RicoQatarRomaniaRussian FederationRwandaSamoaSaudi ArabiaSenegalSerbiaSeychellesSierra LeoneSingaporeSlovak RepublicSloveniaSmall statesSomaliaSouth AfricaSouth AsiaSouth Asia (IDA & IBRD)South SudanSpainSri LankaSub-Saharan Africa Sub-Saharan Africa (excluding high income)Sub-Saharan Africa (IDA & IBRD countries)SudanSurinameSwazilandSwedenSwitzerlandSyrian Arab RepublicTajikistanTanzaniaThailandTimor-LesteTogoTrinidad and TobagoTunisiaTurkeyTurkmenistanUgandaUkraineUnited Arab EmiratesUnited KingdomUnited StatesUpper middle incomeUruguayUzbekistanVanuatuVenezuela, RBVietnamWest Bank and GazaWorldZambiaZimbabwe

línea de tiempo (timeline):

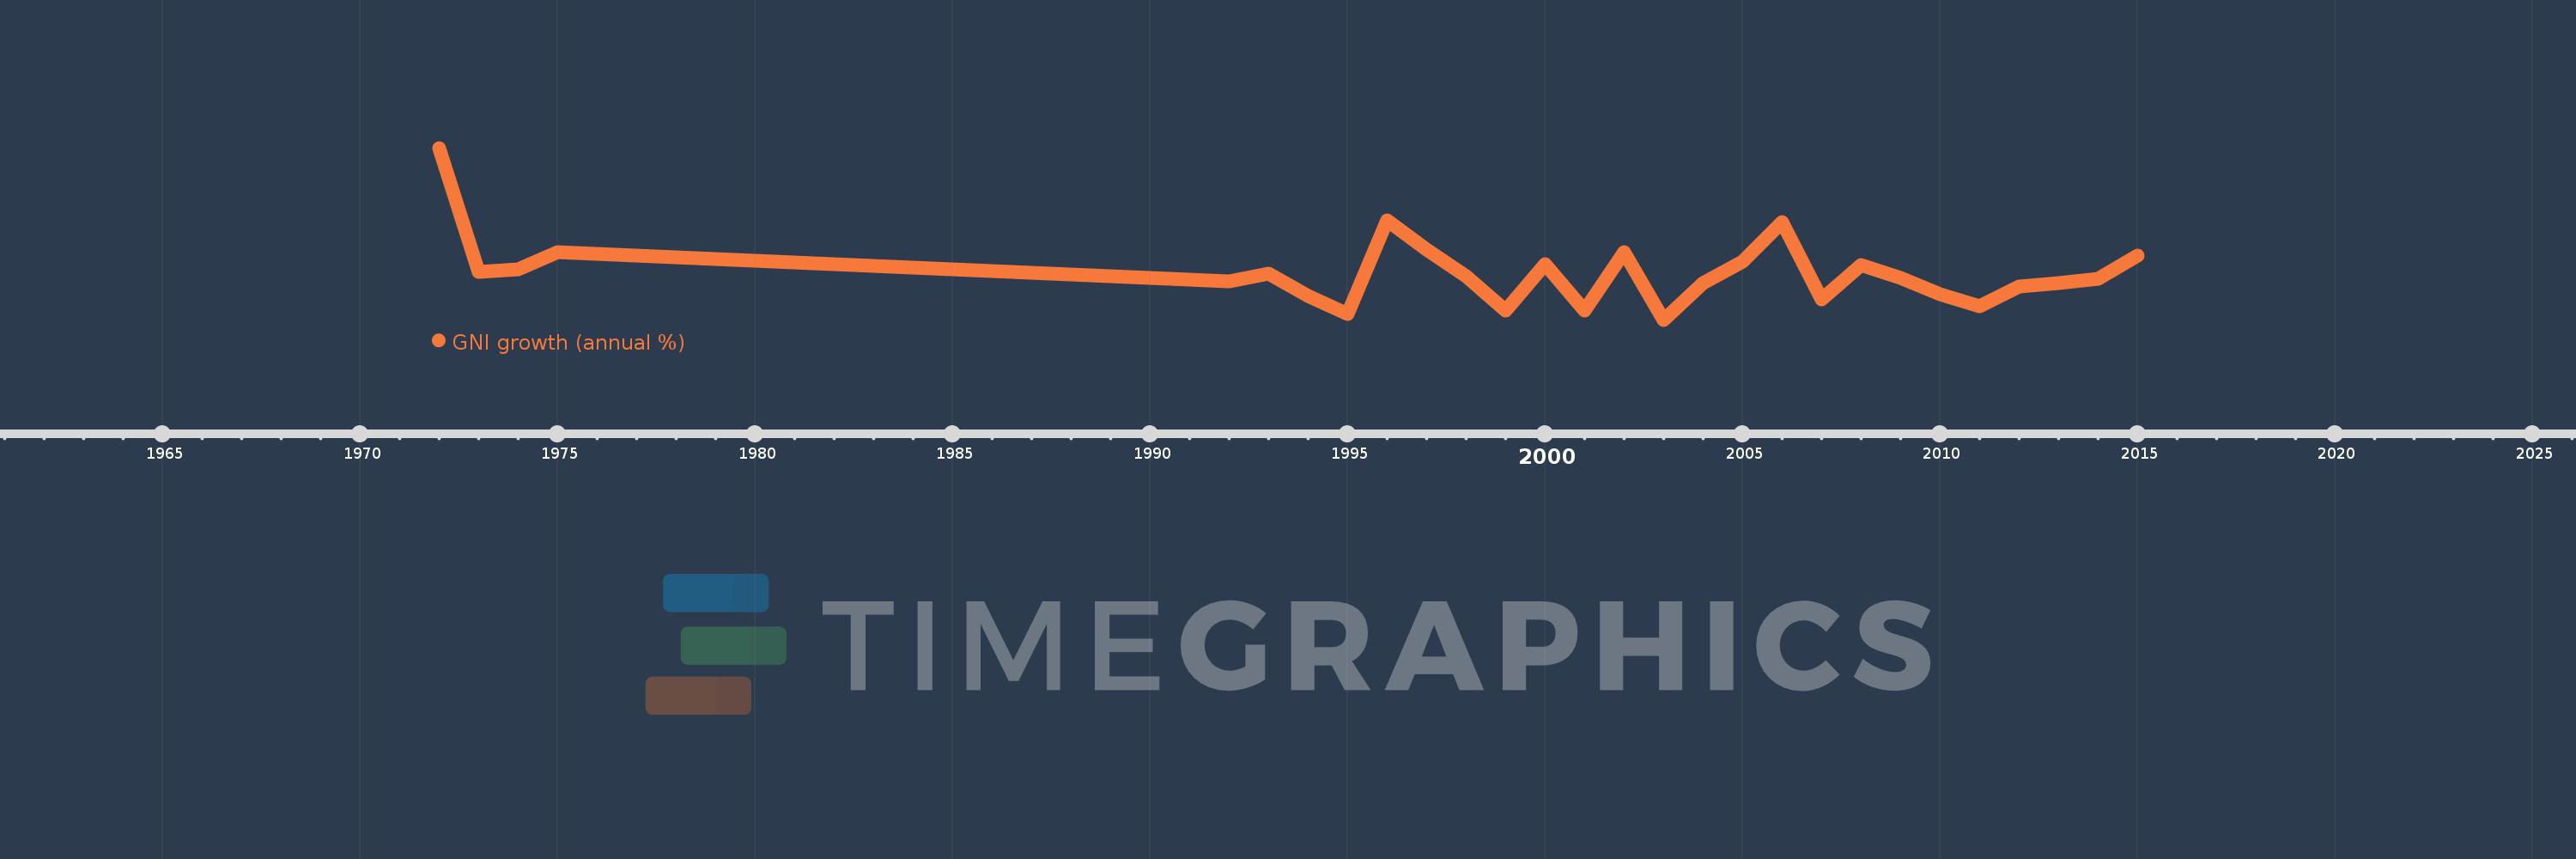
En esta escala de tiempo se presenta un gráfico de 1972 y 2015 de Swaziland. Los datos de 1971 están ausentes. El número de observaciones reales por fecha: 28.

Fuente (nombre):

Indicadores del desarrollo mundial

Fuente (organización):

World Bank national accounts data, and OECD National Accounts data files.

Categorías:

Economy & Growth

Se ha actualizado:

23 abr 2017 año

Los indicadores de los cambios de valor en los últimos años

En promedio:
3.79
Mínimo:
-3.126
1 ene 2003 año
Máximo:
21.868
1 ene 1972 año
A la fecha de observación
Valor
Cambio absoluto
El cambio con respecto al valor anterior
1 ene 1972 año
21.868
+21.868
0.0%
1 ene 1973 año
3.843
-18.025
-82.43%
1 ene 1974 año
4.23
+0.388
10.09%
1 ene 1975 año
6.756
+2.525
59.7%
1 ene 1992 año
2.484
-4.271
-63.23%
1 ene 1993 año
3.593
+1.109
44.63%
1 ene 1994 año
0.315
-3.278
-91.23%
1 ene 1995 año
-2.308
-2.623
-832.8%
1 ene 1996 año
11.311
+13.62
-589.99%
1 ene 1997 año
7.057
-4.255
-37.61%
1 ene 1998 año
3.188
-3.868
-54.82%
1 ene 1999 año
-1.732
-4.92
-154.31%
1 ene 2000 año
4.908
+6.64
-383.41%
1 ene 2001 año
-1.768
-6.675
-136.02%
1 ene 2002 año
6.748
+8.515
-481.73%
1 ene 2003 año
-3.126
-9.874
-146.33%
1 ene 2004 año
2.173
+5.299
-169.5%
1 ene 2005 año
5.37
+3.197
147.15%
1 ene 2006 año
11.118
+5.748
107.05%
1 ene 2007 año
-0.192
-11.31
-101.73%
1 ene 2008 año
4.859
+5.051
-2.63 mil%
1 ene 2009 año
3.008
-1.851
-38.09%
1 ene 2010 año
0.585
-2.423
-80.56%
1 ene 2011 año
-1.198
-1.783
-304.95%
1 ene 2012 año
1.72
+2.919
-243.55%
1 ene 2013 año
2.24
+0.52
30.2%
1 ene 2014 año
2.834
+0.594
26.52%
1 ene 2015 año
6.237
+3.403
120.07%

Ranking de los países por los datos estadísticos actuales