33
/es/
AIzaSyAYiBZKx7MnpbEhh9jyipgxe19OcubqV5w
August 1, 2025
244611
Somalia
SOM
true
2
1
GNI growth (annual %)
1990,1989,1988,1987,1986,1985,1984,1983,1982,1981,1980,1979,1978,1977,1976,1975,1974,1973,1972,1971,1970,1969,1968,1967,1966,1965,1964,1963,1962
Download
Estadísticas Globales de la Biblioteca →Somalia →

GNI growth (annual %)

Estas estadísticas en otros países:

AlbaniaAlgeriaAngolaAntigua and BarbudaArab WorldArgentinaArmeniaAustraliaAustriaAzerbaijanBahamas, TheBahrainBangladeshBarbadosBelarusBelgiumBelizeBeninBhutanBoliviaBosnia and HerzegovinaBotswanaBrazilBrunei DarussalamBulgariaBurkina FasoBurundiCabo VerdeCambodiaCameroonCanadaCaribbean small statesCentral Europe and the BalticsChadChileChinaColombiaComorosCongo, Dem. Rep.Congo, Rep.Costa RicaCote d'IvoireCroatiaCubaCyprusCzech RepublicDenmarkDjiboutiDominican RepublicEarly-demographic dividendEast Asia & PacificEast Asia & Pacific (excluding high income)East Asia & Pacific (IDA & IBRD countries)EcuadorEgypt, Arab Rep.El SalvadorEquatorial GuineaEritreaEstoniaEthiopiaEuro areaEurope & Central AsiaEurope & Central Asia (excluding high income)Europe & Central Asia (IDA & IBRD countries)European UnionFijiFinlandFranceGabonGambia, TheGeorgiaGermanyGhanaGreeceGuatemalaGuineaGuinea-BissauHaitiHeavily indebted poor countries (HIPC)High incomeHondurasHong Kong SAR, ChinaHungaryIBRD onlyIcelandIDA & IBRD totalIDA blendIDA onlyIDA totalIndiaIndonesiaIran, Islamic Rep.IrelandIsraelItalyJamaicaJapanJordanKazakhstanKenyaKorea, Rep.KosovoKuwaitKyrgyz RepublicLao PDRLate-demographic dividendLatin America & Caribbean Latin America & Caribbean (excluding high income)Latin America & the Caribbean (IDA & IBRD countries)LatviaLeast developed countries: UN classificationLebanonLiberiaLibyaLithuaniaLow & middle incomeLow incomeLower middle incomeLuxembourgMacao SAR, ChinaMacedonia, FYRMadagascarMalawiMalaysiaMaliMaltaMauritaniaMauritiusMexicoMiddle East & North AfricaMiddle East & North Africa (excluding high income)Middle East & North Africa (IDA & IBRD countries)Middle incomeMoldovaMongoliaMontenegroMoroccoMozambiqueMyanmarNamibiaNepalNetherlandsNew ZealandNicaraguaNigerNigeriaNorth AmericaNorwayOECD membersOmanOther small statesPakistanPanamaPapua New GuineaParaguayPeruPhilippinesPolandPortugalPost-demographic dividendPre-demographic dividendPuerto RicoQatarRomaniaRussian FederationRwandaSamoaSaudi ArabiaSenegalSerbiaSeychellesSierra LeoneSingaporeSlovak RepublicSloveniaSmall statesSomaliaSouth AfricaSouth AsiaSouth Asia (IDA & IBRD)South SudanSpainSri LankaSub-Saharan Africa Sub-Saharan Africa (excluding high income)Sub-Saharan Africa (IDA & IBRD countries)SudanSurinameSwazilandSwedenSwitzerlandSyrian Arab RepublicTajikistanTanzaniaThailandTimor-LesteTogoTrinidad and TobagoTunisiaTurkeyTurkmenistanUgandaUkraineUnited Arab EmiratesUnited KingdomUnited StatesUpper middle incomeUruguayUzbekistanVanuatuVenezuela, RBVietnamWest Bank and GazaWorldZambiaZimbabwe

línea de tiempo (timeline):

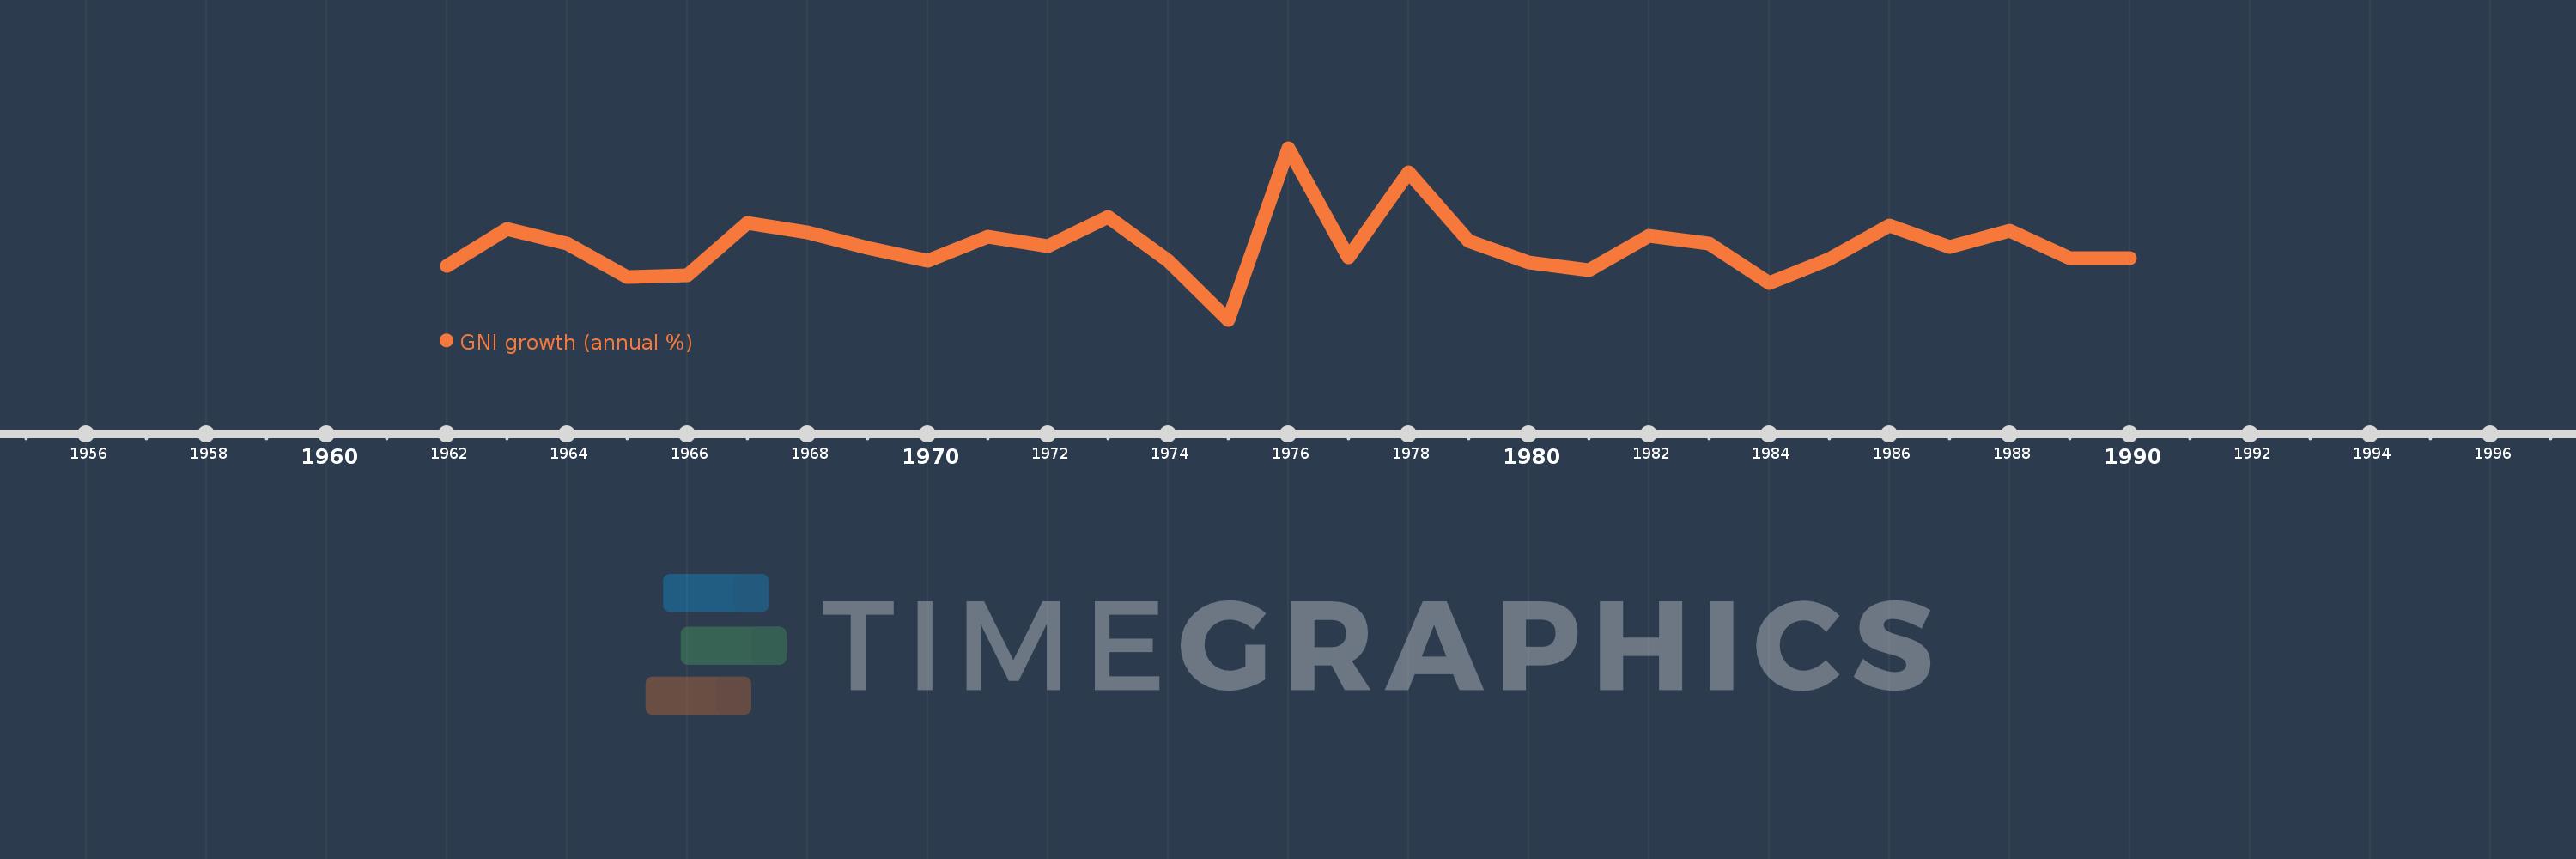
En esta escala de tiempo se presenta un gráfico de 1962 y 1990 de Somalia. Los datos de 1961 están ausentes. El número de observaciones reales por fecha: 29.

Fuente (nombre):

Indicadores del desarrollo mundial

Fuente (organización):

World Bank national accounts data, and OECD National Accounts data files.

Categorías:

Economy & Growth

Se ha actualizado:

23 abr 2017 año

Los indicadores de los cambios de valor en los últimos años

En promedio:
2.408
Mínimo:
-18.18
1 ene 1975 año
Máximo:
29.614
1 ene 1976 año
A la fecha de observación
Valor
Cambio absoluto
El cambio con respecto al valor anterior
1 ene 1962 año
-3.258
-3.258
0.0%
1 ene 1963 año
7.134
+10.392
-318.95%
1 ene 1964 año
2.901
-4.232
-59.33%
1 ene 1965 año
-6.222
-9.124
-314.44%
1 ene 1966 año
-5.903
+0.319
-5.13%
1 ene 1967 año
8.863
+14.766
-250.15%
1 ene 1968 año
6.103
-2.76
-31.14%
1 ene 1969 año
1.904
-4.199
-68.81%
1 ene 1970 año
-1.687
-3.591
-188.6%
1 ene 1971 año
4.935
+6.621
-392.55%
1 ene 1972 año
2.416
-2.518
-51.04%
1 ene 1973 año
10.323
+7.907
327.24%
1 ene 1974 año
-1.75
-12.073
-116.95%
1 ene 1975 año
-18.18
-16.43
938.83%
1 ene 1976 año
29.614
+47.794
-262.9%
1 ene 1977 año
-0.91
-30.524
-103.07%
1 ene 1978 año
22.885
+23.795
-2.61 mil%
1 ene 1979 año
3.747
-19.138
-83.63%
1 ene 1980 año
-2.212
-5.959
-159.05%
1 ene 1981 año
-4.339
-2.127
96.15%
1 ene 1982 año
5.158
+9.497
-218.85%
1 ene 1983 año
3.078
-2.079
-40.32%
1 ene 1984 año
-8.067
-11.145
-362.07%
1 ene 1985 año
-1.312
+6.755
-83.74%
1 ene 1986 año
8.018
+9.329
-711.33%
1 ene 1987 año
2.029
-5.989
-74.7%
1 ene 1988 año
6.674
+4.645
228.99%
1 ene 1989 año
-1.083
-7.757
-116.23%
1 ene 1990 año
-1.036
+0.048
-4.41%

Ranking de los países por los datos estadísticos actuales