29
/es/
es
AIzaSyAYiBZKx7MnpbEhh9jyipgxe19OcubqV5w
April 1, 2024
214331
Norway
NOR
true
2
1
GNI growth (annual %)
2016,2015,2014,2013,2012,2011,2010,2009,2008,2007,2006,2005,2004,2003,2002,2001,2000,1999,1998,1997,1970,1969,1968,1967,1966,1965,1964,1963,1962
Download
Estadísticas Globales de la Biblioteca →Norway →

GNI growth (annual %)

Estas estadísticas en otros países:
AlbaniaAlgeriaAngolaAntigua and BarbudaArab WorldArgentinaArmeniaAustraliaAustriaAzerbaijanBahamas, TheBahrainBangladeshBarbadosBelarusBelgiumBelizeBeninBhutanBoliviaBosnia and HerzegovinaBotswanaBrazilBrunei DarussalamBulgariaBurkina FasoBurundiCabo VerdeCambodiaCameroonCanadaCaribbean small statesCentral Europe and the BalticsChadChileChinaColombiaComorosCongo, Dem. Rep.Congo, Rep.Costa RicaCote d'IvoireCroatiaCubaCyprusCzech RepublicDenmarkDjiboutiDominican RepublicEarly-demographic dividendEast Asia & PacificEast Asia & Pacific (excluding high income)East Asia & Pacific (IDA & IBRD countries)EcuadorEgypt, Arab Rep.El SalvadorEquatorial GuineaEritreaEstoniaEthiopiaEuro areaEurope & Central AsiaEurope & Central Asia (excluding high income)Europe & Central Asia (IDA & IBRD countries)European UnionFijiFinlandFranceGabonGambia, TheGeorgiaGermanyGhanaGreeceGuatemalaGuineaGuinea-BissauHaitiHeavily indebted poor countries (HIPC)High incomeHondurasHong Kong SAR, ChinaHungaryIBRD onlyIcelandIDA & IBRD totalIDA blendIDA onlyIDA totalIndiaIndonesiaIran, Islamic Rep.IrelandIsraelItalyJamaicaJapanJordanKazakhstanKenyaKorea, Rep.KosovoKuwaitKyrgyz RepublicLao PDRLate-demographic dividendLatin America & Caribbean Latin America & Caribbean (excluding high income)Latin America & the Caribbean (IDA & IBRD countries)LatviaLeast developed countries: UN classificationLebanonLiberiaLibyaLithuaniaLow & middle incomeLow incomeLower middle incomeLuxembourgMacao SAR, ChinaMacedonia, FYRMadagascarMalawiMalaysiaMaliMaltaMauritaniaMauritiusMexicoMiddle East & North AfricaMiddle East & North Africa (excluding high income)Middle East & North Africa (IDA & IBRD countries)Middle incomeMoldovaMongoliaMontenegroMoroccoMozambiqueMyanmarNamibiaNepalNetherlandsNew ZealandNicaraguaNigerNigeriaNorth AmericaNorwayOECD membersOmanOther small statesPakistanPanamaPapua New GuineaParaguayPeruPhilippinesPolandPortugalPost-demographic dividendPre-demographic dividendPuerto RicoQatarRomaniaRussian FederationRwandaSamoaSaudi ArabiaSenegalSerbiaSeychellesSierra LeoneSingaporeSlovak RepublicSloveniaSmall statesSomaliaSouth AfricaSouth AsiaSouth Asia (IDA & IBRD)South SudanSpainSri LankaSub-Saharan Africa Sub-Saharan Africa (excluding high income)Sub-Saharan Africa (IDA & IBRD countries)SudanSurinameSwazilandSwedenSwitzerlandSyrian Arab RepublicTajikistanTanzaniaThailandTimor-LesteTogoTrinidad and TobagoTunisiaTurkeyTurkmenistanUgandaUkraineUnited Arab EmiratesUnited KingdomUnited StatesUpper middle incomeUruguayUzbekistanVanuatuVenezuela, RBVietnamWest Bank and GazaWorldZambiaZimbabwe
línea de tiempo (timeline):
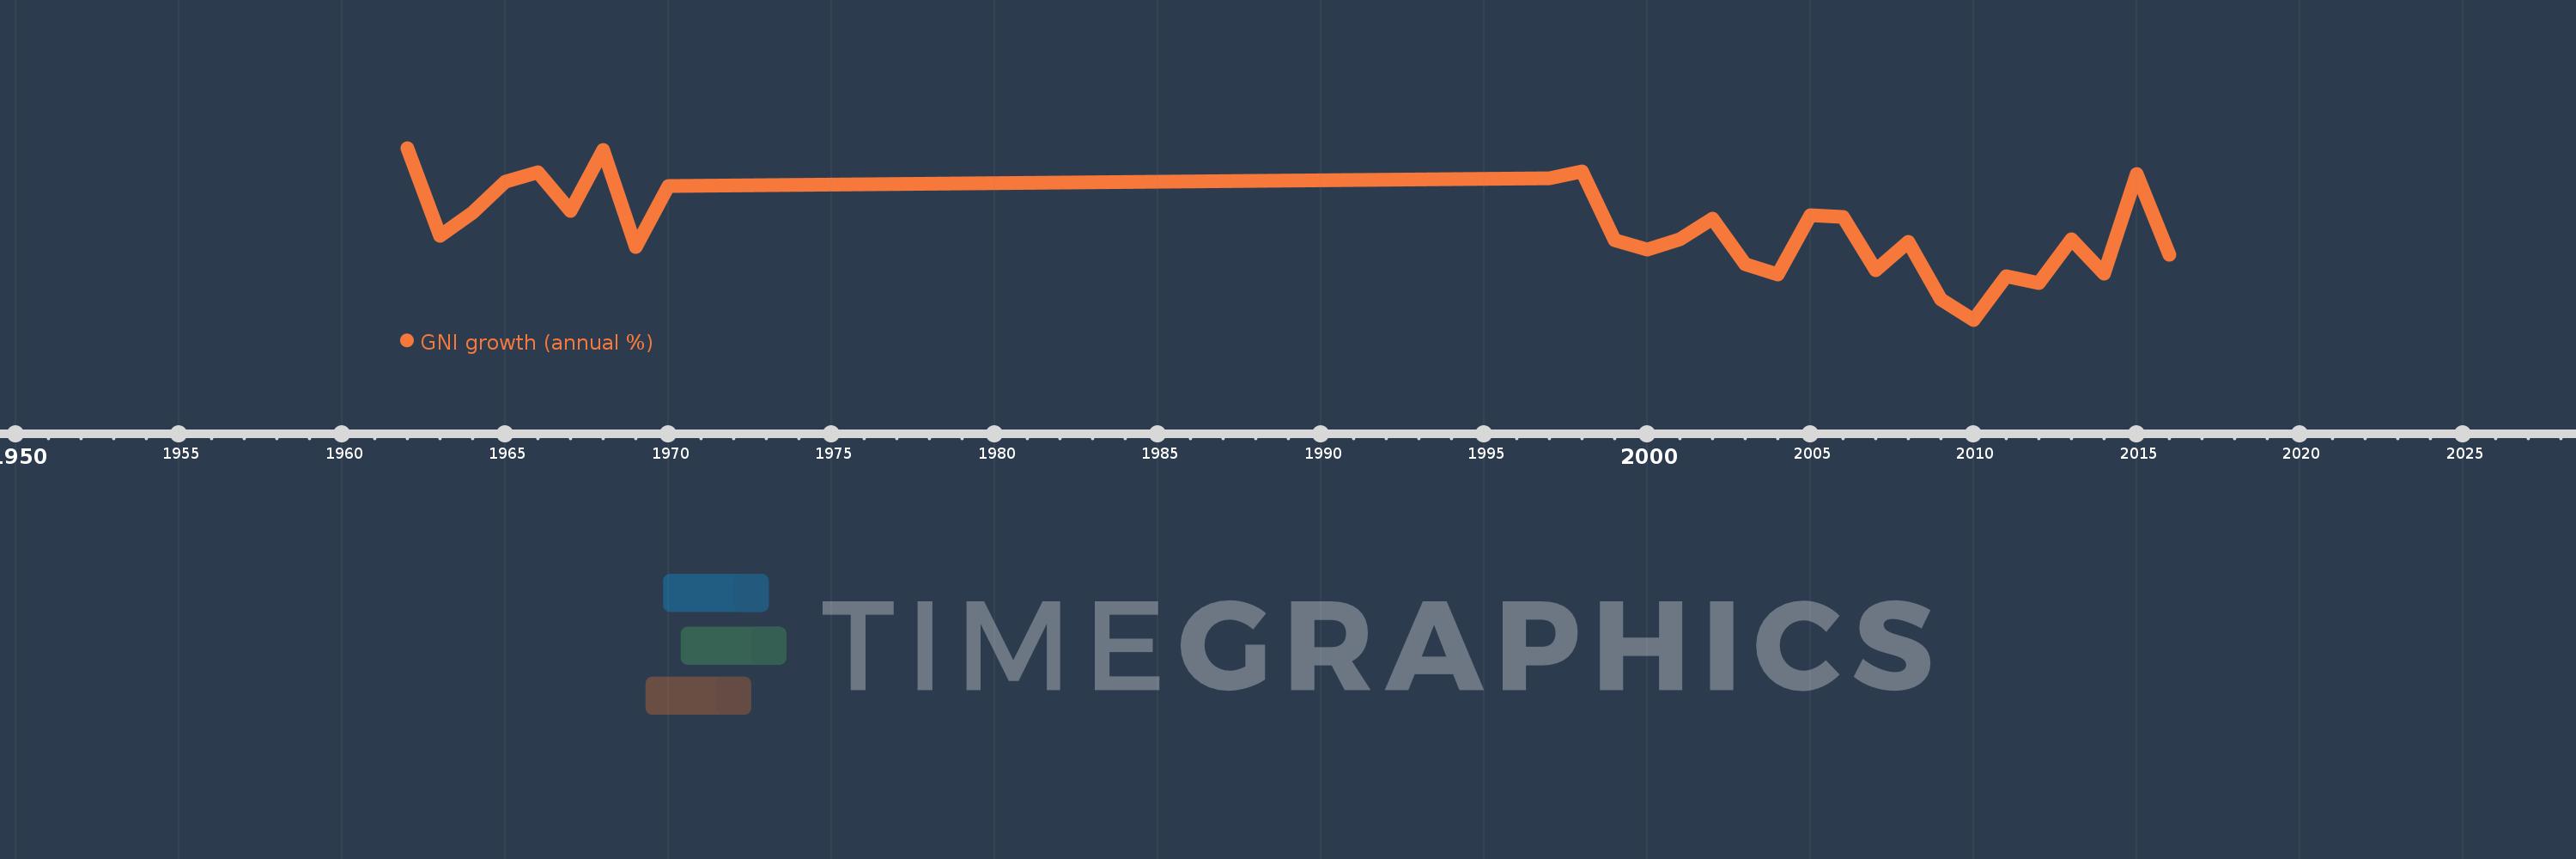
En esta escala de tiempo se presenta un gráfico de 1962 y 2016 de Norway. Los datos de 1961 están ausentes. El número de observaciones reales por fecha: 29.
Fuente (nombre):
Indicadores del desarrollo mundial
Fuente (organización):
World Bank national accounts data, and OECD National Accounts data files.
Categorías:
Economy & Growth
Se ha actualizado:
23 abr 2017 año
Los indicadores de los cambios de valor en los últimos años
En promedio:
3.035
Mínimo:
-0.611
1 ene 2010 año
Máximo:
6.299
1 ene 1962 año
A la fecha de observación
Valor
Cambio absoluto
El cambio con respecto al valor anterior
1 ene 1962 año
6.299
+6.299
0.0%
1 ene 1963 año
2.776
-3.523
-55.93%
1 ene 1964 año
3.682
+0.906
32.64%
1 ene 1965 año
4.948
+1.266
34.38%
1 ene 1966 año
5.305
+0.357
7.21%
1 ene 1967 año
3.763
-1.542
-29.07%
1 ene 1968 año
6.234
+2.471
65.68%
1 ene 1969 año
2.312
-3.922
-62.91%
1 ene 1970 año
4.759
+2.447
105.86%
1 ene 1997 año
5.082
+0.323
6.78%
1 ene 1998 año
5.363
+0.281
5.53%
1 ene 1999 año
2.593
-2.77
-51.65%
1 ene 2000 año
2.219
-0.374
-14.44%
1 ene 2001 año
2.64
+0.422
19.01%
1 ene 2002 año
3.44
+0.799
30.28%
1 ene 2003 año
1.627
-1.813
-52.7%
1 ene 2004 año
1.197
-0.43
-26.41%
1 ene 2005 año
3.577
+2.38
198.8%
1 ene 2006 año
3.541
-0.037
-1.02%
1 ene 2007 año
1.387
-2.154
-60.82%
1 ene 2008 año
2.534
+1.147
82.71%
1 ene 2009 año
0.214
-2.321
-91.57%
1 ene 2010 año
-0.611
-0.824
-385.88%
1 ene 2011 año
1.128
+1.739
-284.78%
1 ene 2012 año
0.875
-0.253
-22.41%
1 ene 2013 año
2.631
+1.756
200.57%
1 ene 2014 año
1.251
-1.381
-52.47%
1 ene 2015 año
5.244
+3.994
319.34%
1 ene 2016 año
1.994
-3.25
-61.98%
Ranking de los países por los datos estadísticos actuales

Comentarios:

Enviar
PremiumAbout & FeedbackAcuerdoPrivacidad
logo
© 2022 Selected Technologies LLC – Morgan Hill, California