33
/es/
AIzaSyB4mHJ5NPEv-XzF7P6NDYXjlkCWaeKw5bc
November 1, 2025
246210
South Africa
ZAF
true
2
1
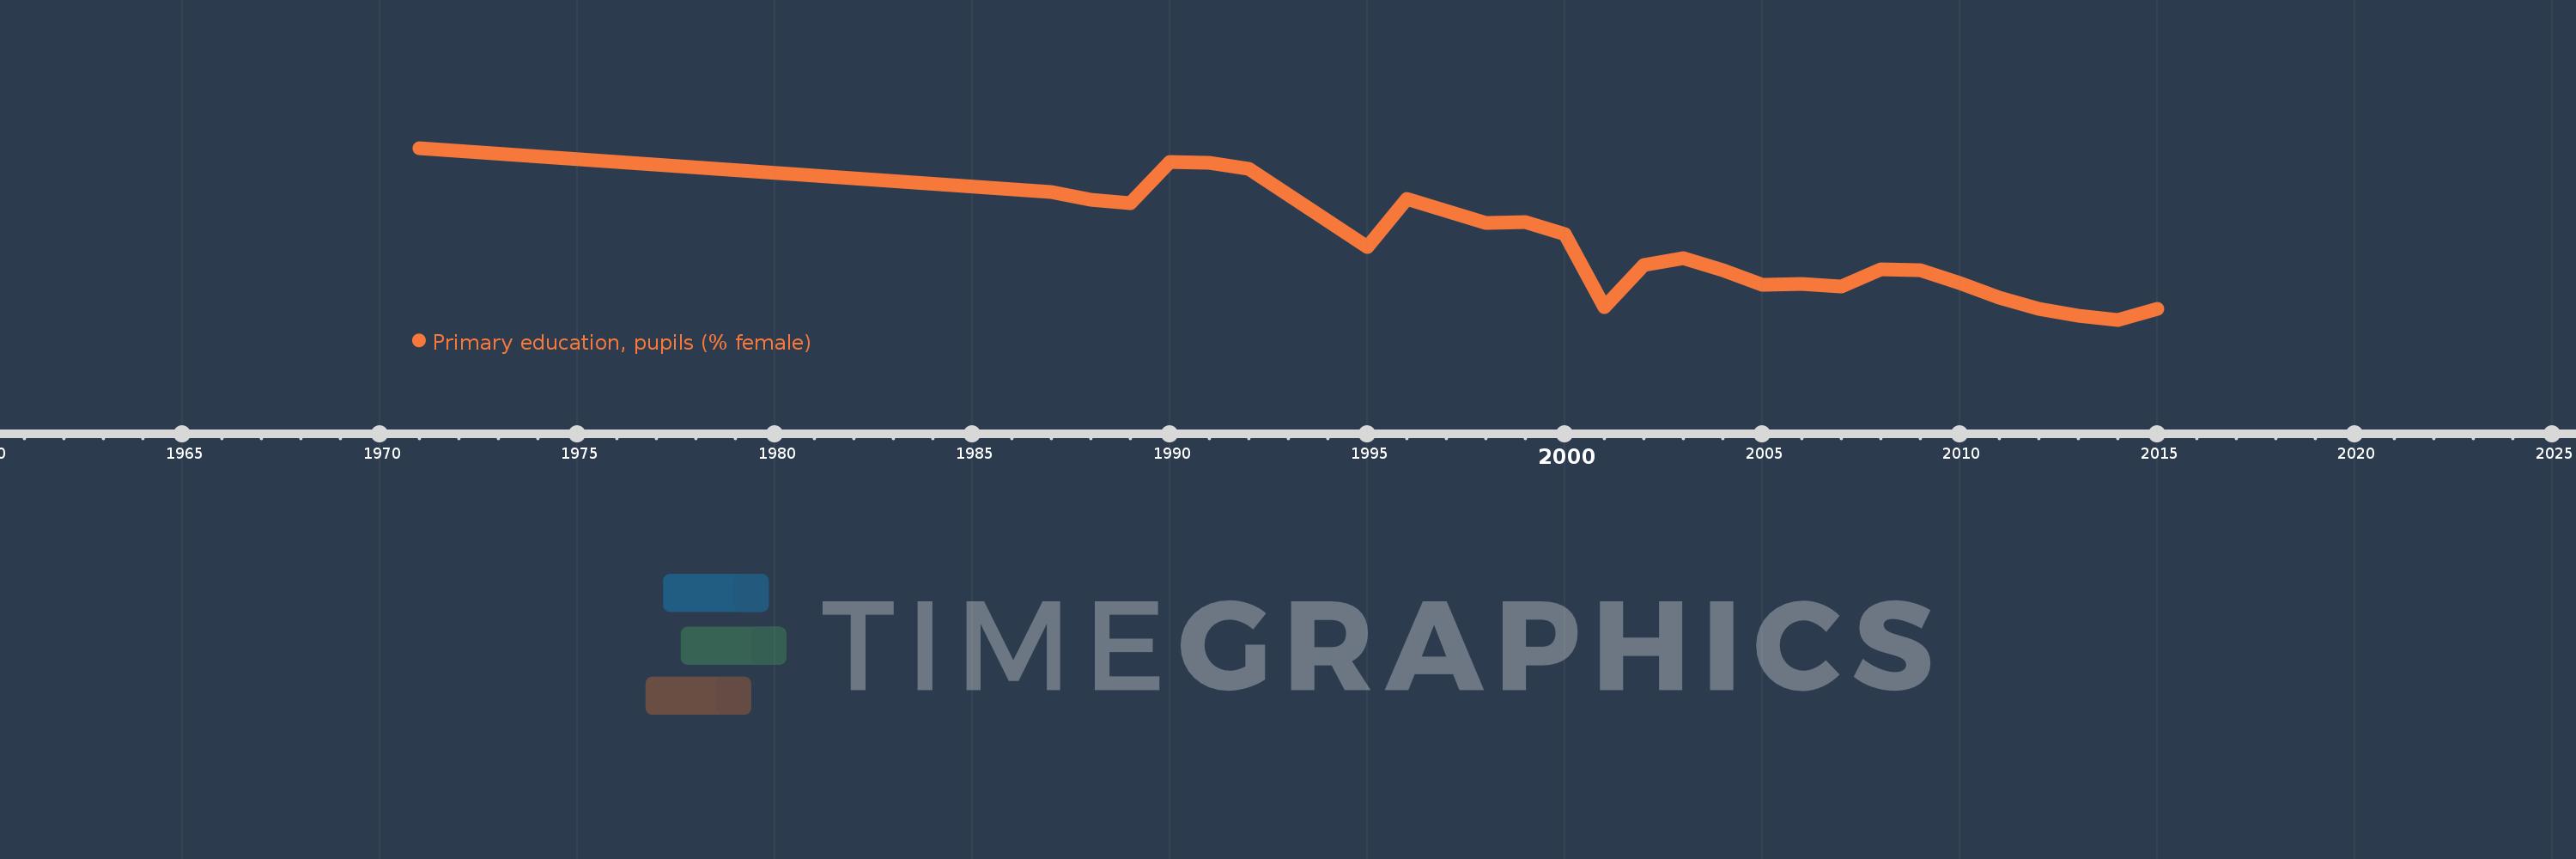
Primary education, pupils (% female)
2015,2014,2013,2012,2011,2010,2009,2008,2007,2006,2005,2004,2003,2002,2001,2000,1999,1998,1996,1995,1992,1991,1990,1989,1988,1987,1971