33
/es/
AIzaSyB4mHJ5NPEv-XzF7P6NDYXjlkCWaeKw5bc
November 1, 2025
244135
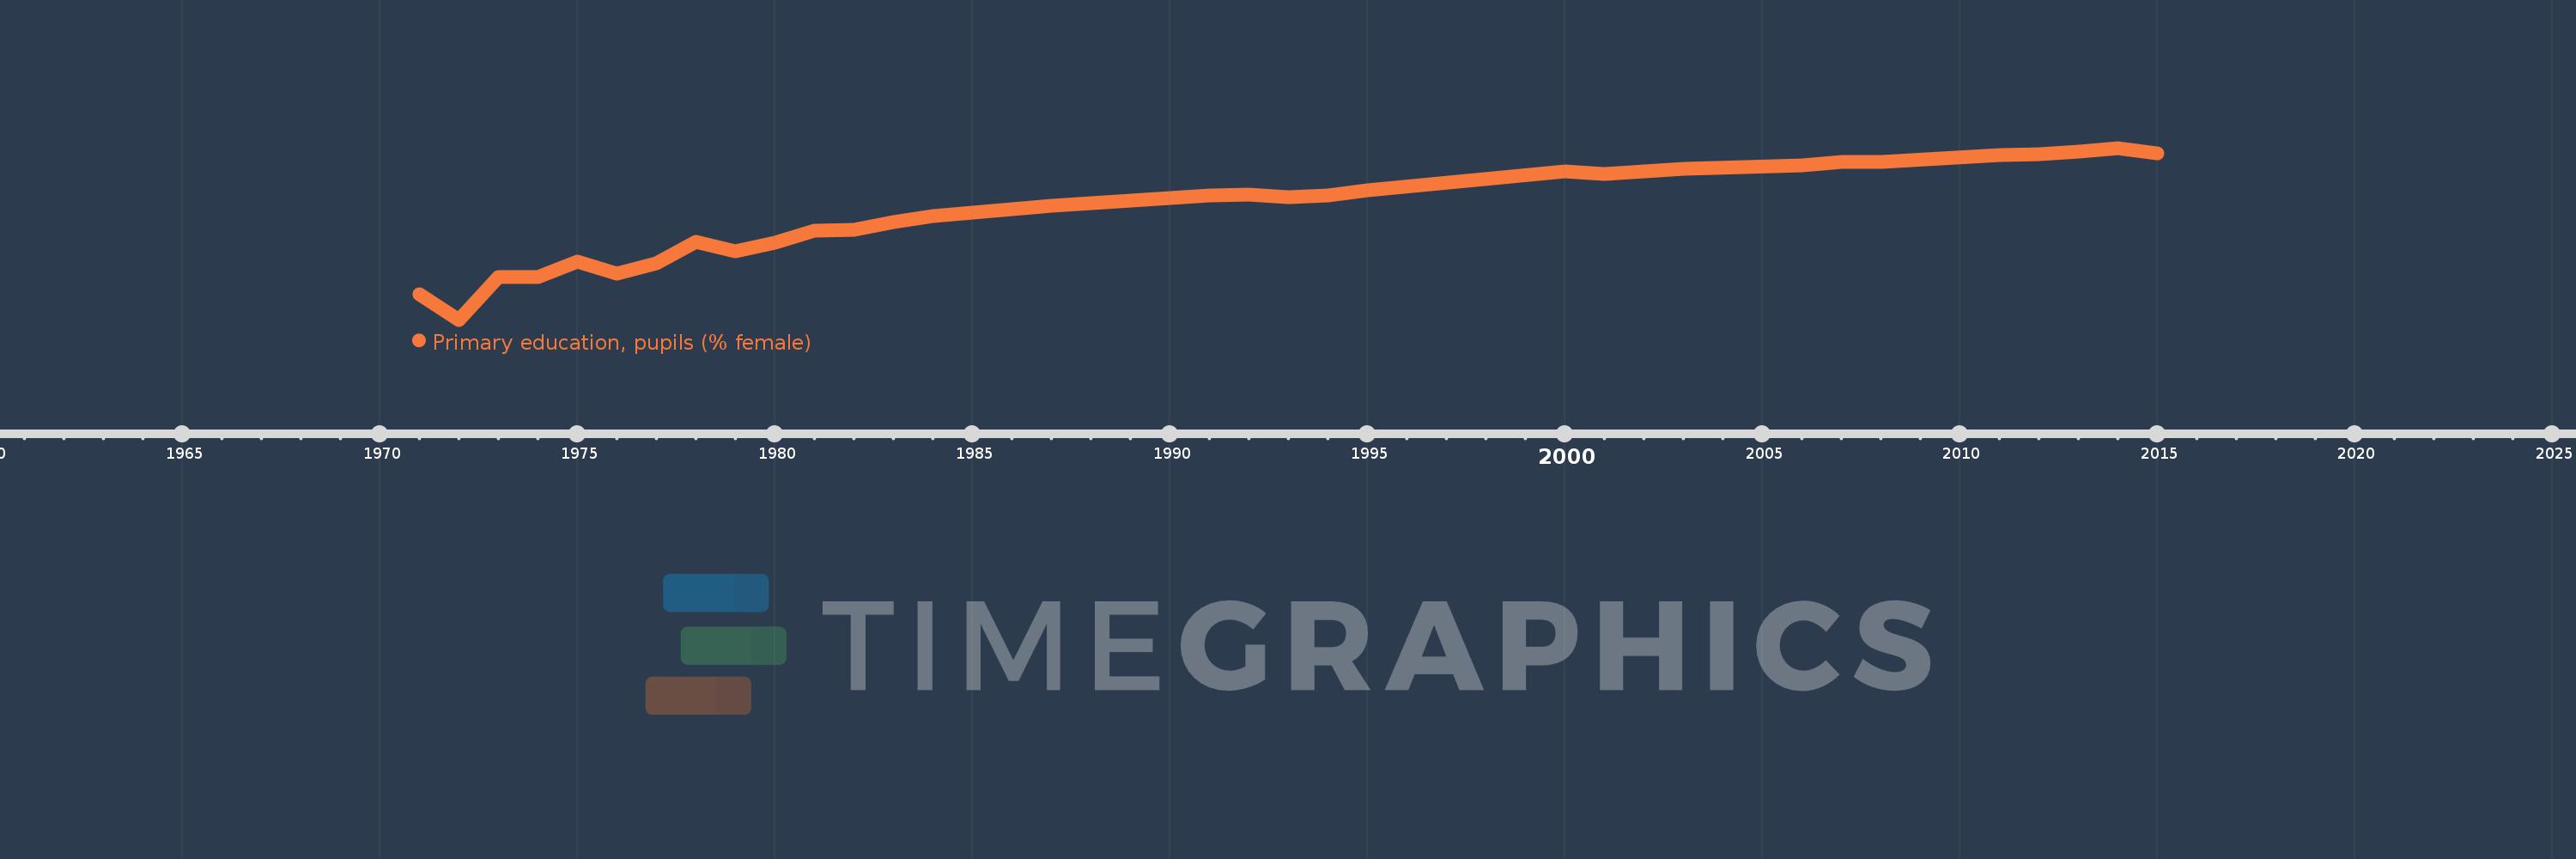
Solomon Islands
SLB
true
2
1
Primary education, pupils (% female)
2015,2014,2013,2012,2011,2008,2007,2006,2003,2001,2000,1995,1994,1993,1992,1991,1987,1984,1983,1982,1981,1980,1979,1978,1977,1976,1975,1974,1973,1972,1971