33
/es/
AIzaSyB4mHJ5NPEv-XzF7P6NDYXjlkCWaeKw5bc
November 1, 2025
109028
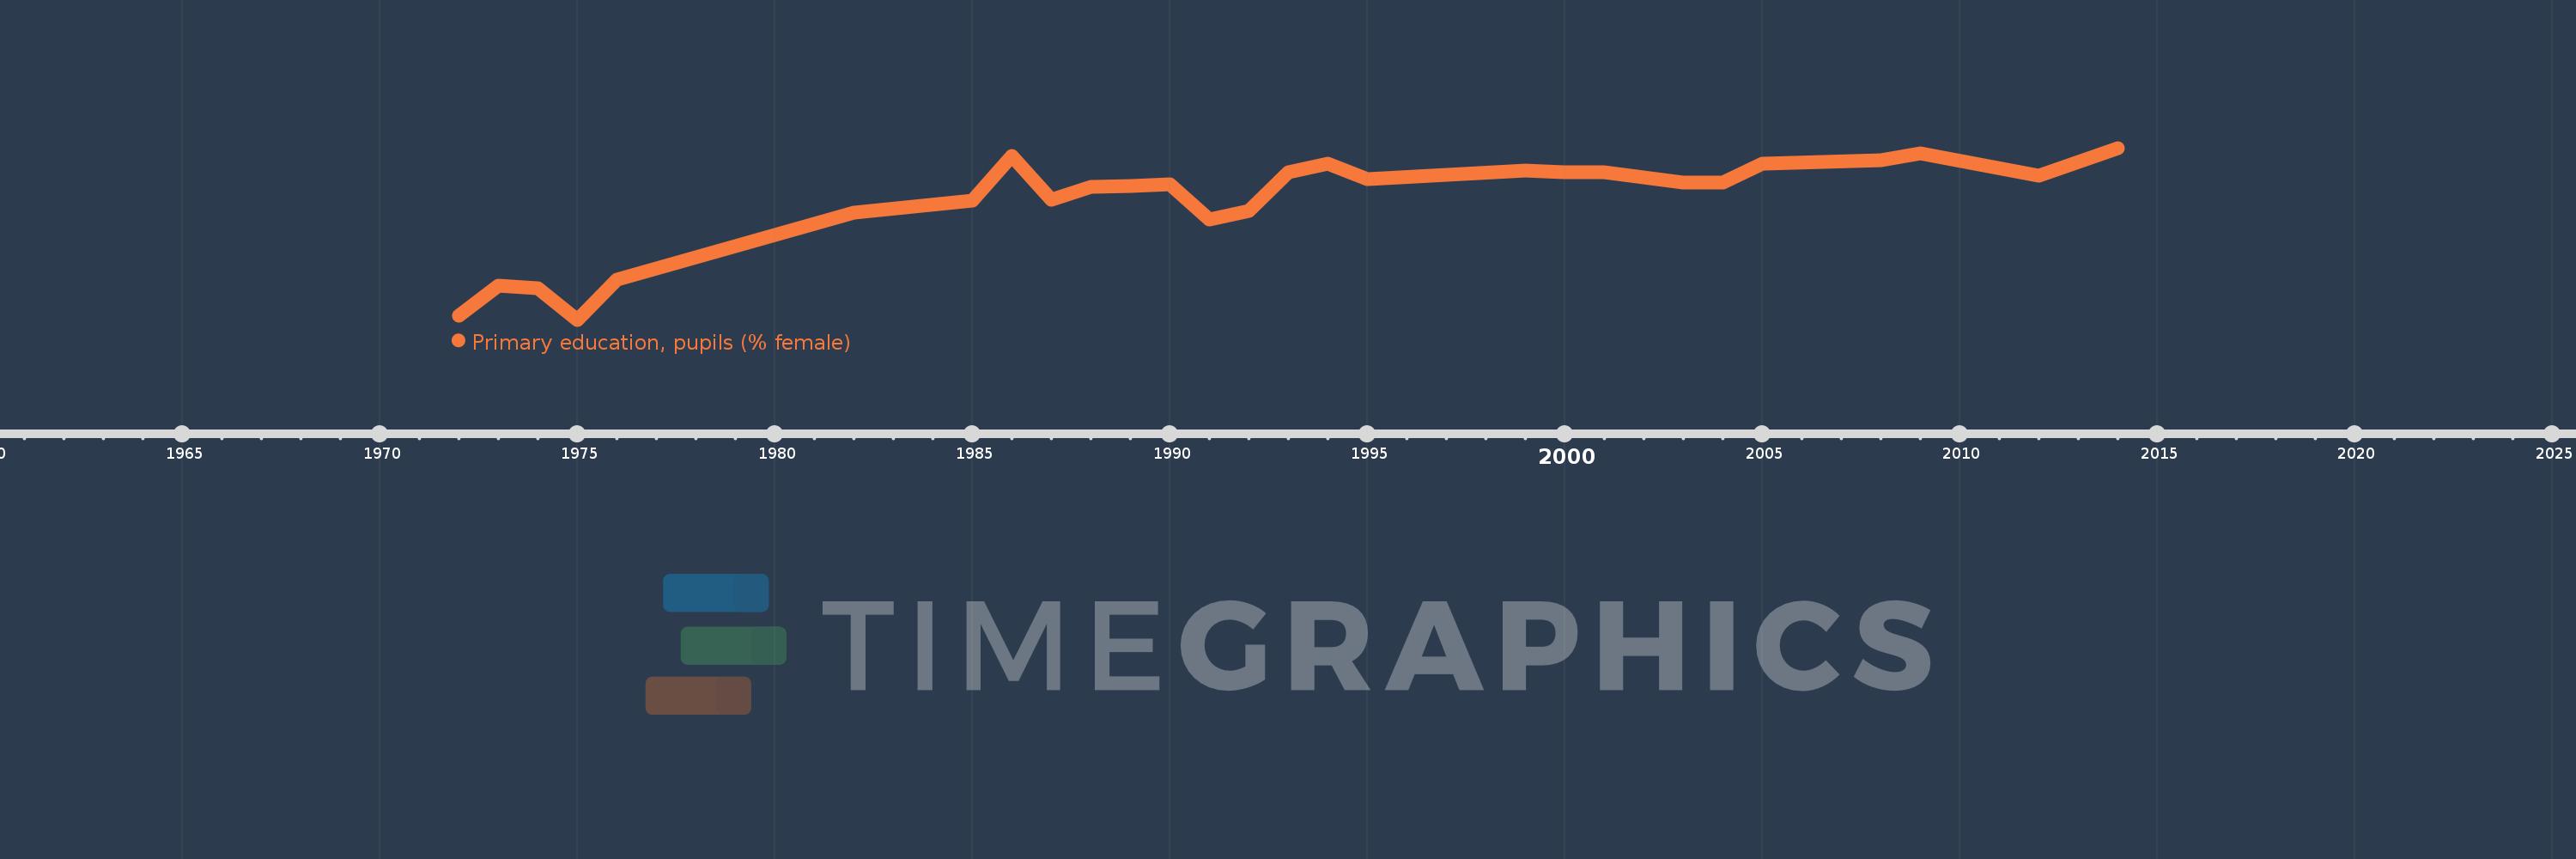
Comoros
COM
true
2
1
Primary education, pupils (% female)
2014,2012,2009,2008,2005,2004,2003,2001,2000,1999,1995,1994,1993,1992,1991,1990,1989,1988,1987,1986,1985,1982,1976,1975,1974,1973,1972