33
/es/
AIzaSyAYiBZKx7MnpbEhh9jyipgxe19OcubqV5w
August 1, 2025
237885
Serbia
SRB
true
2
1
Terms of trade adjustment (constant LCU)
2016,2015,2014,2013,2012,2011,2010,2009,2008,2007,2006,2005,2004,2003,2002,2001,2000,1999,1998,1997,1996
Download
Estadísticas Globales de la Biblioteca →Serbia →

Terms of trade adjustment (constant LCU)

Estas estadísticas en otros países:

AlbaniaAlgeriaAngolaAntigua and BarbudaArgentinaArmeniaAustraliaAustriaAzerbaijanBahamas, TheBahrainBangladeshBarbadosBelarusBelgiumBelizeBeninBhutanBoliviaBosnia and HerzegovinaBotswanaBrazilBrunei DarussalamBulgariaBurkina FasoBurundiCabo VerdeCambodiaCameroonCanadaChadChileColombiaComorosCongo, Dem. Rep.Congo, Rep.Costa RicaCote d'IvoireCroatiaCubaCyprusCzech RepublicDenmarkDjiboutiDominican RepublicEcuadorEgypt, Arab Rep.El SalvadorEquatorial GuineaEritreaEstoniaEthiopiaFijiFinlandFranceGabonGambia, TheGeorgiaGermanyGhanaGreeceGuatemalaGuineaGuinea-BissauHaitiHondurasHong Kong SAR, ChinaHungaryIcelandIndiaIndonesiaIran, Islamic Rep.IrelandIsraelItalyJamaicaJapanJordanKazakhstanKenyaKorea, Rep.KosovoKuwaitKyrgyz RepublicLao PDRLatviaLebanonLiberiaLibyaLithuaniaLuxembourgMacao SAR, ChinaMacedonia, FYRMadagascarMalawiMalaysiaMaliMaltaMauritaniaMauritiusMexicoMoldovaMongoliaMontenegroMoroccoMozambiqueMyanmarNamibiaNepalNetherlandsNew ZealandNicaraguaNigerNigeriaNorwayOmanPakistanPanamaPapua New GuineaParaguayPeruPhilippinesPolandPortugalPuerto RicoQatarRomaniaRussian FederationRwandaSamoaSaudi ArabiaSenegalSerbiaSeychellesSierra LeoneSingaporeSlovak RepublicSloveniaSomaliaSouth AfricaSouth SudanSpainSri LankaSudanSurinameSwazilandSwedenSwitzerlandSyrian Arab RepublicTajikistanTanzaniaThailandTimor-LesteTogoTrinidad and TobagoTunisiaTurkeyTurkmenistanUgandaUkraineUnited Arab EmiratesUnited KingdomUnited StatesUruguayUzbekistanVanuatuVenezuela, RBVietnamWest Bank and GazaZambiaZimbabwe

línea de tiempo (timeline):

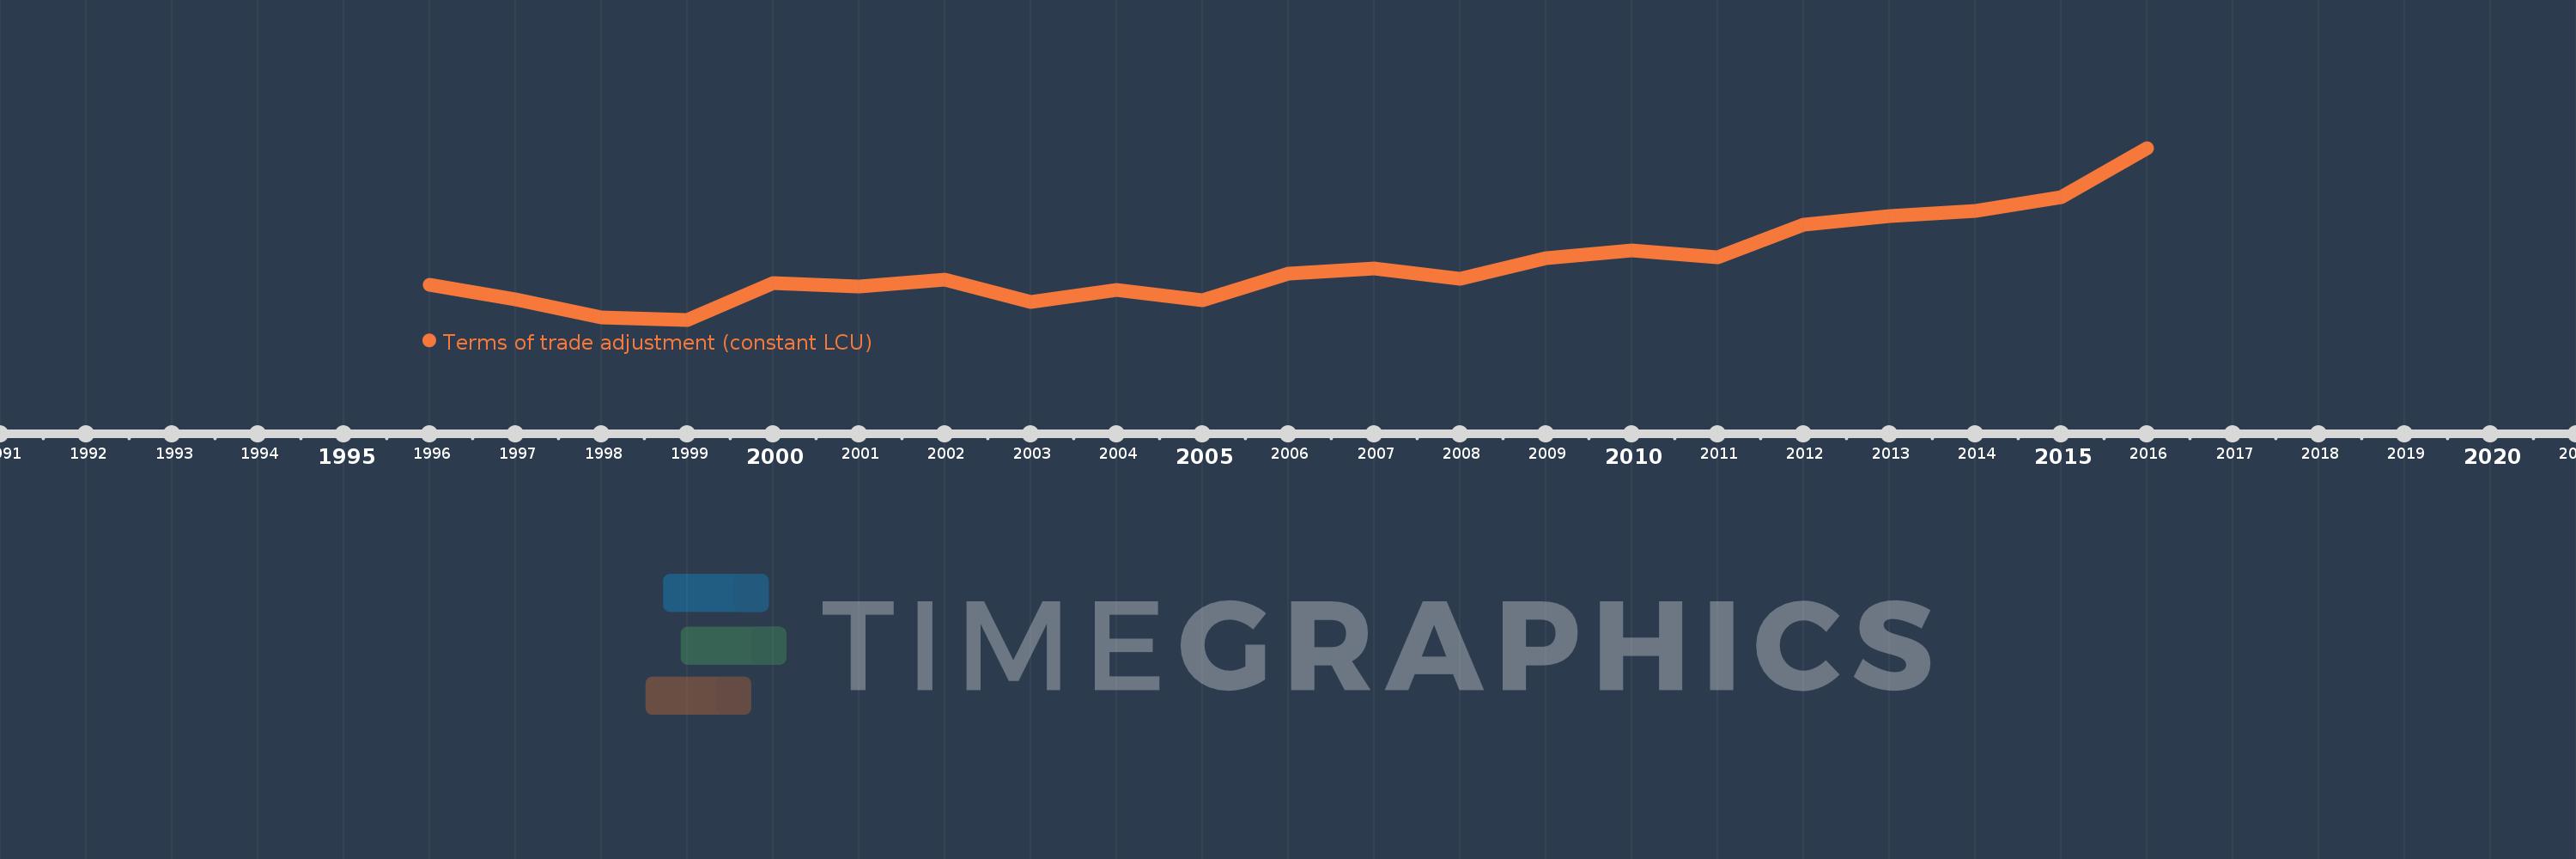
En esta escala de tiempo se presenta un gráfico de 1996 y 2016 de Serbia. Los datos de 1995 están ausentes. El número de observaciones reales por fecha: 21.

Fuente (nombre):

Indicadores del desarrollo mundial

Fuente (organización):

World Bank national accounts data, and OECD National Accounts data files.

Categorías:

Economy & Growth

Se ha actualizado:

23 abr 2017 año

Los indicadores de los cambios de valor en los últimos años

En promedio:
-6.321 bn
Mínimo:
-58.007 bn
1 ene 1999 año
Máximo:
101.629 bn
1 ene 2016 año
A la fecha de observación
Valor
Cambio absoluto
El cambio con respecto al valor anterior
1 ene 1996 año
-25.69 bn
-25.69 bn
0.0%
1 ene 1997 año
-39.08 bn
-13.39 bn
52.12%
1 ene 1998 año
-55.67 bn
-16.591 bn
42.45%
1 ene 1999 año
-58.007 bn
-2.337 bn
4.2%
1 ene 2000 año
-24.183 bn
+33.824 bn
-58.31%
1 ene 2001 año
-27.438 bn
-3.256 bn
13.46%
1 ene 2002 año
-21.112 bn
+6.327 bn
-23.06%
1 ene 2003 año
-41.201 bn
-20.089 bn
95.15%
1 ene 2004 año
-30.268 bn
+10.933 bn
-26.54%
1 ene 2005 año
-39.913 bn
-9.645 bn
31.87%
1 ene 2006 año
-14.894 bn
+25.019 bn
-62.68%
1 ene 2007 año
-10.479 bn
+4.415 bn
-29.64%
1 ene 2008 año
-19.682 bn
-9.203 bn
87.82%
1 ene 2009 año
-681.751 millones
+19.0 bn
-96.54%
1 ene 2010 año
6.347 bn
+7.029 bn
-1.03 mil%
1 ene 2011 año
0.0
-6.347 bn
-100.0%
1 ene 2012 año
30.51 bn
+30.51 bn
%
1 ene 2013 año
38.163 bn
+7.653 bn
25.08%
1 ene 2014 año
43.338 bn
+5.175 bn
13.56%
1 ene 2015 año
55.579 bn
+12.241 bn
28.24%
1 ene 2016 año
101.629 bn
+46.05 bn
82.86%

Ranking de los países por los datos estadísticos actuales