33
/es/
AIzaSyAYiBZKx7MnpbEhh9jyipgxe19OcubqV5w
August 1, 2025
153149
Hungary
HUN
true
2
1
Terms of trade adjustment (constant LCU)
2016,2015,2014,2013,2012,2011,2010,2009,2008,2007,2006,2005,2004,2003,2002,2001,2000,1999,1998,1997,1996,1995,1994,1993,1992
Download
Estadísticas Globales de la Biblioteca →Hungary →

Terms of trade adjustment (constant LCU)

Estas estadísticas en otros países:

AlbaniaAlgeriaAngolaAntigua and BarbudaArgentinaArmeniaAustraliaAustriaAzerbaijanBahamas, TheBahrainBangladeshBarbadosBelarusBelgiumBelizeBeninBhutanBoliviaBosnia and HerzegovinaBotswanaBrazilBrunei DarussalamBulgariaBurkina FasoBurundiCabo VerdeCambodiaCameroonCanadaChadChileColombiaComorosCongo, Dem. Rep.Congo, Rep.Costa RicaCote d'IvoireCroatiaCubaCyprusCzech RepublicDenmarkDjiboutiDominican RepublicEcuadorEgypt, Arab Rep.El SalvadorEquatorial GuineaEritreaEstoniaEthiopiaFijiFinlandFranceGabonGambia, TheGeorgiaGermanyGhanaGreeceGuatemalaGuineaGuinea-BissauHaitiHondurasHong Kong SAR, ChinaHungaryIcelandIndiaIndonesiaIran, Islamic Rep.IrelandIsraelItalyJamaicaJapanJordanKazakhstanKenyaKorea, Rep.KosovoKuwaitKyrgyz RepublicLao PDRLatviaLebanonLiberiaLibyaLithuaniaLuxembourgMacao SAR, ChinaMacedonia, FYRMadagascarMalawiMalaysiaMaliMaltaMauritaniaMauritiusMexicoMoldovaMongoliaMontenegroMoroccoMozambiqueMyanmarNamibiaNepalNetherlandsNew ZealandNicaraguaNigerNigeriaNorwayOmanPakistanPanamaPapua New GuineaParaguayPeruPhilippinesPolandPortugalPuerto RicoQatarRomaniaRussian FederationRwandaSamoaSaudi ArabiaSenegalSerbiaSeychellesSierra LeoneSingaporeSlovak RepublicSloveniaSomaliaSouth AfricaSouth SudanSpainSri LankaSudanSurinameSwazilandSwedenSwitzerlandSyrian Arab RepublicTajikistanTanzaniaThailandTimor-LesteTogoTrinidad and TobagoTunisiaTurkeyTurkmenistanUgandaUkraineUnited Arab EmiratesUnited KingdomUnited StatesUruguayUzbekistanVanuatuVenezuela, RBVietnamWest Bank and GazaZambiaZimbabwe

línea de tiempo (timeline):

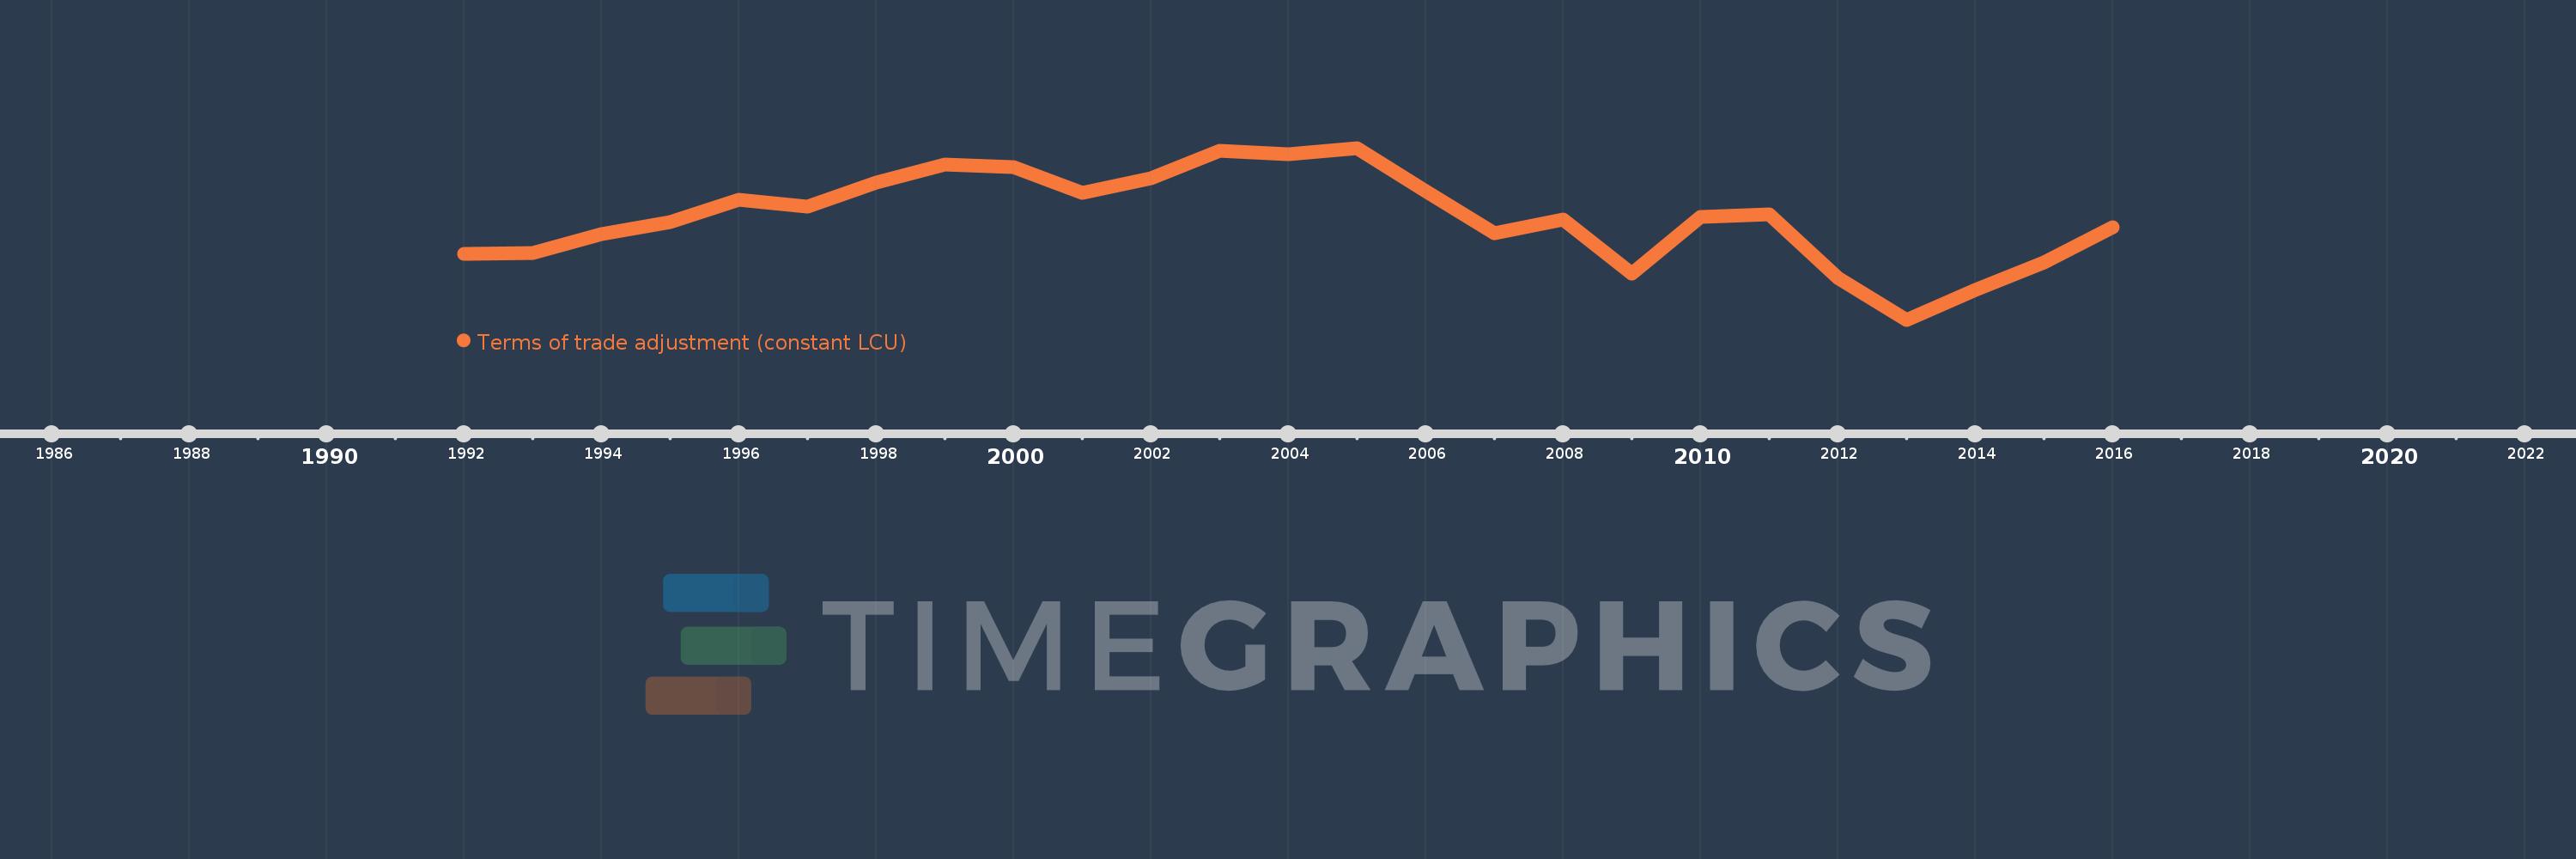
En esta escala de tiempo se presenta un gráfico de 1992 y 2016 de Hungary. Los datos de 1991 están ausentes. El número de observaciones reales por fecha: 25.

Fuente (nombre):

Indicadores del desarrollo mundial

Fuente (organización):

World Bank national accounts data, and OECD National Accounts data files.

Categorías:

Economy & Growth

Se ha actualizado:

23 abr 2017 año

Los indicadores de los cambios de valor en los últimos años

En promedio:
-17.194 bn
Mínimo:
-550.251 bn
1 ene 2013 año
Máximo:
344.326 bn
1 ene 2005 año
A la fecha de observación
Valor
Cambio absoluto
El cambio con respecto al valor anterior
1 ene 1992 año
-206.041 bn
-206.041 bn
0.0%
1 ene 1993 año
-203.702 bn
+2.339 bn
-1.14%
1 ene 1994 año
-105.656 bn
+98.046 bn
-48.13%
1 ene 1995 año
-43.912 bn
+61.744 bn
-58.44%
1 ene 1996 año
72.763 bn
+116.675 bn
-265.7%
1 ene 1997 año
40.78 bn
-31.983 bn
-43.96%
1 ene 1998 año
163.811 bn
+123.031 bn
301.69%
1 ene 1999 año
259.462 bn
+95.651 bn
58.39%
1 ene 2000 año
244.705 bn
-14.757 bn
-5.69%
1 ene 2001 año
110.238 bn
-134.467 bn
-54.95%
1 ene 2002 año
184.22 bn
+73.982 bn
67.11%
1 ene 2003 año
330.306 bn
+146.086 bn
79.3%
1 ene 2004 año
310.134 bn
-20.172 bn
-6.11%
1 ene 2005 año
344.326 bn
+34.192 bn
11.02%
1 ene 2006 año
120.527 bn
-223.799 bn
-65.0%
1 ene 2007 año
-100.579 bn
-221.106 bn
-183.45%
1 ene 2008 año
-28.094 bn
+72.485 bn
-72.07%
1 ene 2009 año
-309.241 bn
-281.147 bn
1.0 mil%
1 ene 2010 año
-16.895 bn
+292.347 bn
-94.54%
1 ene 2011 año
0.0
+16.895 bn
-100.0%
1 ene 2012 año
-332.694 bn
-332.694 bn
%
1 ene 2013 año
-550.251 bn
-217.557 bn
65.39%
1 ene 2014 año
-393.119 bn
+157.133 bn
-28.56%
1 ene 2015 año
-253.24 bn
+139.879 bn
-35.58%
1 ene 2016 año
-67.707 bn
+185.533 bn
-73.26%

Ranking de los países por los datos estadísticos actuales