29
/es/
es
AIzaSyAYiBZKx7MnpbEhh9jyipgxe19OcubqV5w
April 1, 2024
161057
Israel
ISR
true
2
1
Terms of trade adjustment (constant LCU)
2016,2015,2014,2013,2012,2011,2010,2009,2008,2007,2006,2005,2004,2003,2002,2001,2000,1999,1998,1997,1996
Download
Estadísticas Globales de la Biblioteca →Israel →

Terms of trade adjustment (constant LCU)

Estas estadísticas en otros países:
AlbaniaAlgeriaAngolaAntigua and BarbudaArgentinaArmeniaAustraliaAustriaAzerbaijanBahamas, TheBahrainBangladeshBarbadosBelarusBelgiumBelizeBeninBhutanBoliviaBosnia and HerzegovinaBotswanaBrazilBrunei DarussalamBulgariaBurkina FasoBurundiCabo VerdeCambodiaCameroonCanadaChadChileColombiaComorosCongo, Dem. Rep.Congo, Rep.Costa RicaCote d'IvoireCroatiaCubaCyprusCzech RepublicDenmarkDjiboutiDominican RepublicEcuadorEgypt, Arab Rep.El SalvadorEquatorial GuineaEritreaEstoniaEthiopiaFijiFinlandFranceGabonGambia, TheGeorgiaGermanyGhanaGreeceGuatemalaGuineaGuinea-BissauHaitiHondurasHong Kong SAR, ChinaHungaryIcelandIndiaIndonesiaIran, Islamic Rep.IrelandIsraelItalyJamaicaJapanJordanKazakhstanKenyaKorea, Rep.KosovoKuwaitKyrgyz RepublicLao PDRLatviaLebanonLiberiaLibyaLithuaniaLuxembourgMacao SAR, ChinaMacedonia, FYRMadagascarMalawiMalaysiaMaliMaltaMauritaniaMauritiusMexicoMoldovaMongoliaMontenegroMoroccoMozambiqueMyanmarNamibiaNepalNetherlandsNew ZealandNicaraguaNigerNigeriaNorwayOmanPakistanPanamaPapua New GuineaParaguayPeruPhilippinesPolandPortugalPuerto RicoQatarRomaniaRussian FederationRwandaSamoaSaudi ArabiaSenegalSerbiaSeychellesSierra LeoneSingaporeSlovak RepublicSloveniaSomaliaSouth AfricaSouth SudanSpainSri LankaSudanSurinameSwazilandSwedenSwitzerlandSyrian Arab RepublicTajikistanTanzaniaThailandTimor-LesteTogoTrinidad and TobagoTunisiaTurkeyTurkmenistanUgandaUkraineUnited Arab EmiratesUnited KingdomUnited StatesUruguayUzbekistanVanuatuVenezuela, RBVietnamWest Bank and GazaZambiaZimbabwe
línea de tiempo (timeline):
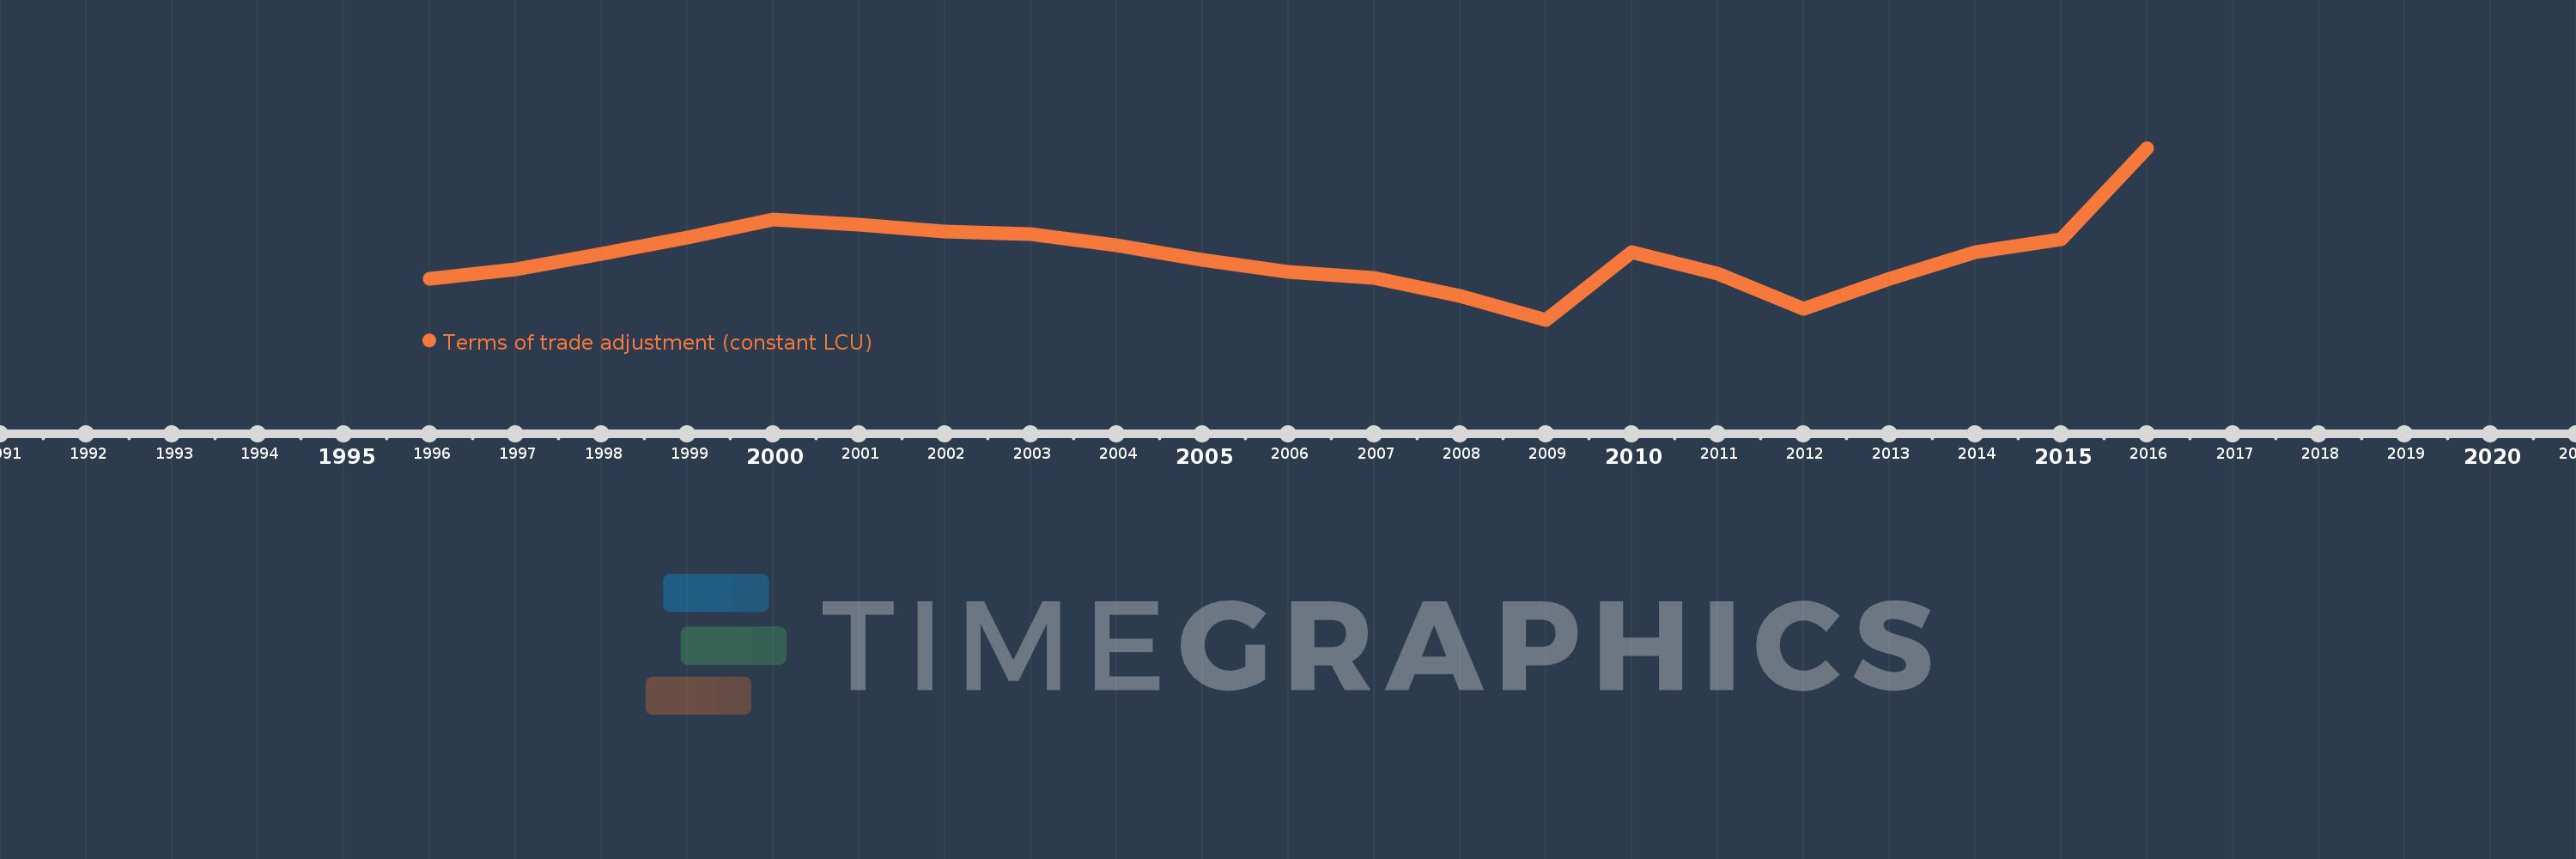
En esta escala de tiempo se presenta un gráfico de 1996 y 2016 de Israel. Los datos de 1995 están ausentes. El número de observaciones reales por fecha: 21.
Fuente (nombre):
Indicadores del desarrollo mundial
Fuente (organización):
World Bank national accounts data, and OECD National Accounts data files.
Categorías:
Economy & Growth
Se ha actualizado:
23 abr 2017 año
Los indicadores de los cambios de valor en los últimos años
En promedio:
5.689 bn
Mínimo:
-15.002 bn
1 ene 2009 año
Máximo:
40.627 bn
1 ene 2016 año
A la fecha de observación
Valor
Cambio absoluto
El cambio con respecto al valor anterior
1 ene 1996 año
-1.809 bn
-1.809 bn
0.0%
1 ene 1997 año
1.345 bn
+3.153 bn
-174.33%
1 ene 1998 año
6.468 bn
+5.124 bn
381.09%
1 ene 1999 año
11.604 bn
+5.135 bn
79.39%
1 ene 2000 año
17.454 bn
+5.85 bn
50.42%
1 ene 2001 año
15.809 bn
-1.646 bn
-9.43%
1 ene 2002 año
13.497 bn
-2.311 bn
-14.62%
1 ene 2003 año
12.696 bn
-801.414 millones
-5.94%
1 ene 2004 año
9.021 bn
-3.675 bn
-28.95%
1 ene 2005 año
4.354 bn
-4.667 bn
-51.73%
1 ene 2006 año
573.048 millones
-3.781 bn
-86.84%
1 ene 2007 año
-1.582 bn
-2.155 bn
-376.08%
1 ene 2008 año
-7.178 bn
-5.596 bn
353.73%
1 ene 2009 año
-15.002 bn
-7.824 bn
108.99%
1 ene 2010 año
6.976 bn
+21.979 bn
-146.5%
1 ene 2011 año
0.0
-6.976 bn
-100.0%
1 ene 2012 año
-11.598 bn
-11.598 bn
%
1 ene 2013 año
-1.705 bn
+9.893 bn
-85.3%
1 ene 2014 año
6.822 bn
+8.527 bn
-500.01%
1 ene 2015 año
11.11 bn
+4.288 bn
62.86%
1 ene 2016 año
40.627 bn
+29.517 bn
265.69%
Ranking de los países por los datos estadísticos actuales

Comentarios:

Enviar
PremiumAbout & FeedbackAcuerdoPrivacidad
logo
© 2022 Selected Technologies LLC – Morgan Hill, California