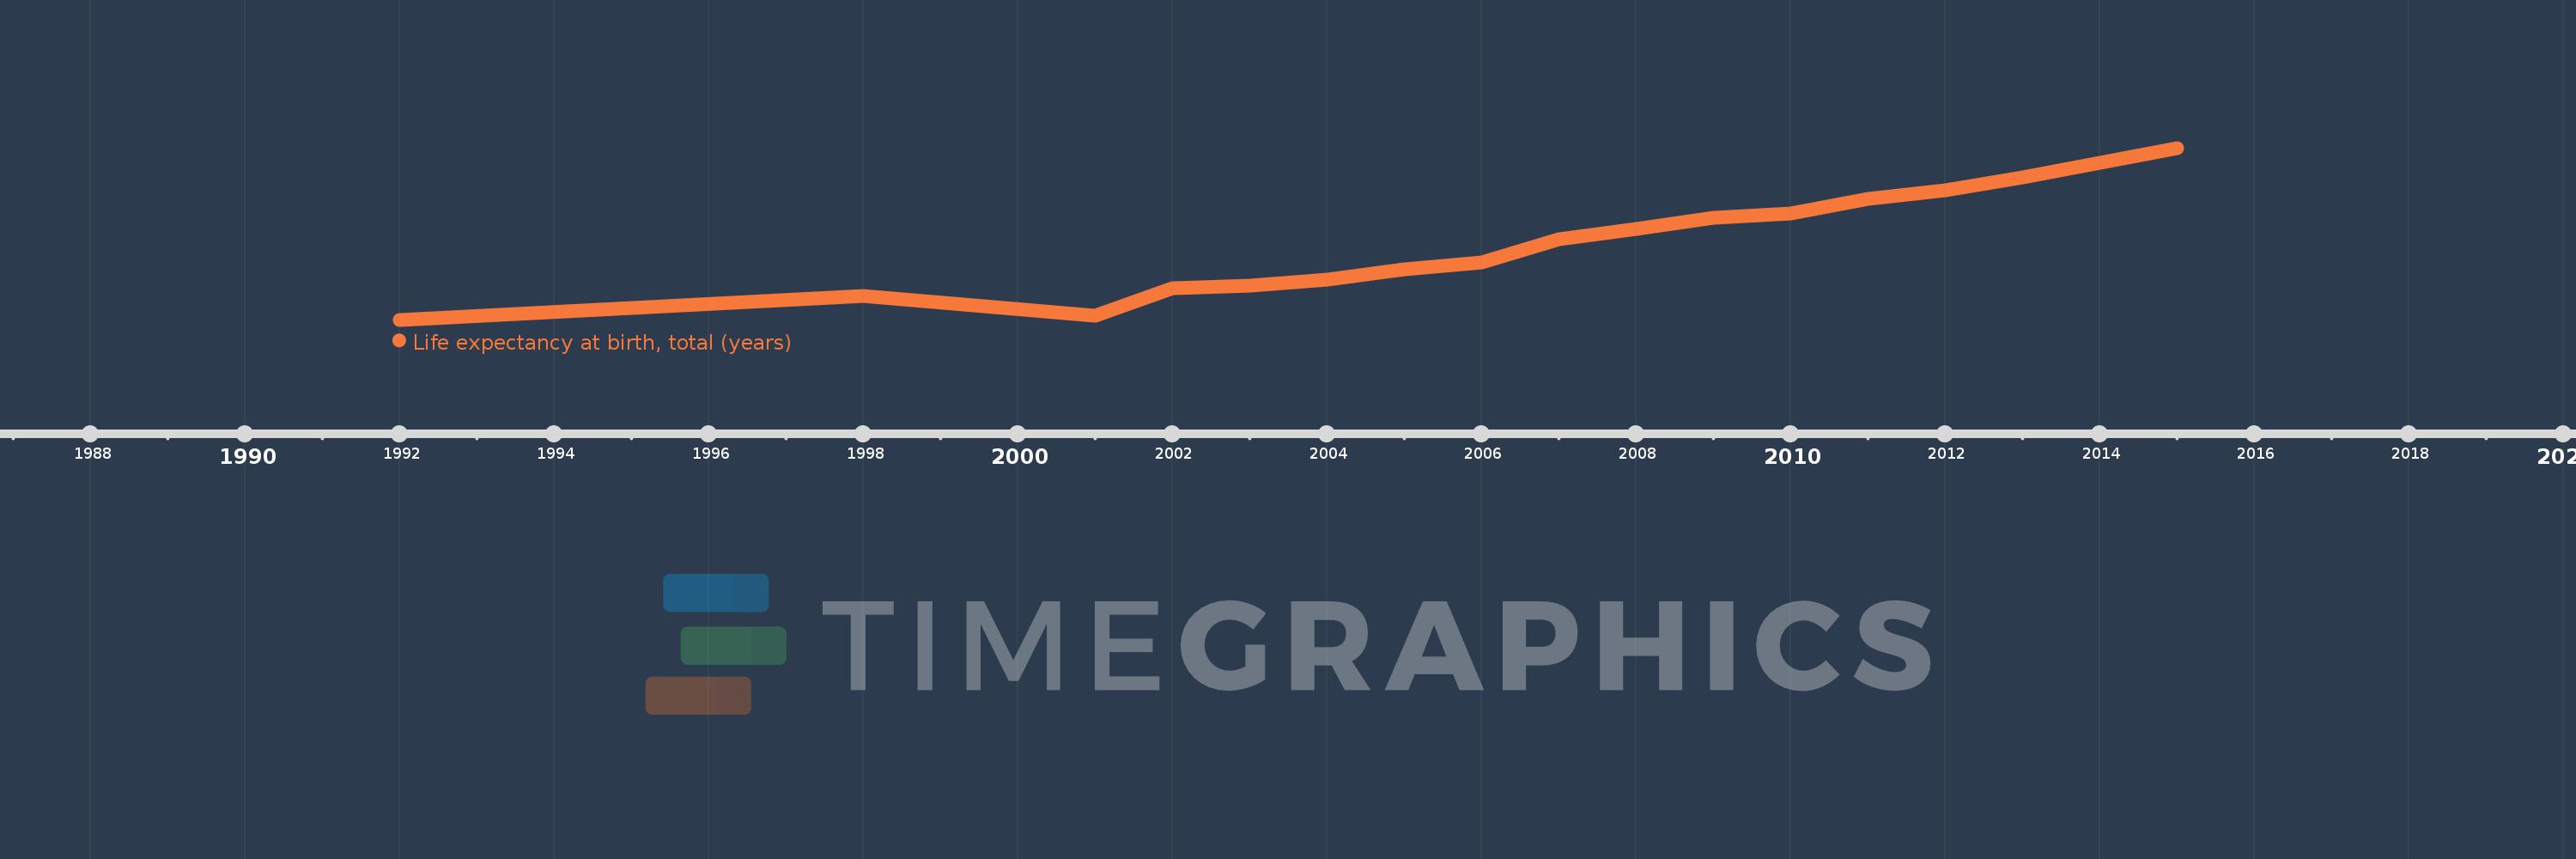
En esta escala de tiempo se presenta un gráfico de 1992 y 2015 de Serbia. Los datos de 1991 están ausentes. El número de observaciones reales por fecha: 17.
Fuente (nombre):
Indicadores del desarrollo mundial
Fuente (organización):
Derived from male and female life expectancy at birth from sources such as: (1) United Nations Population Division. World Population Prospects, (2) Census reports and other statistical publications from national statistical offices, (3) Eurostat: Demographic Statistics, (4) United Nations Statistical Division. Population and Vital Statistics Reprot (various years), (5) U.S. Census Bureau: International Database, and (6) Secretariat of the Pacific Community: Statistics and Demography Programme.
Categorías:
Health
Se ha actualizado:
23 abr 2017 año
Los indicadores de los cambios de valor en los últimos años
En promedio:
73.347
Mínimo:
71.488
1 ene 1992 año
Máximo:
75.534
1 ene 2015 año
A la fecha de observación
Valor
Cambio absoluto
El cambio con respecto al valor anterior
1 ene 1992 año
71.488
+71.488
0.0%
1 ene 1998 año
72.039
+0.551
0.77%
1 ene 2001 año
71.583
-0.456
-0.63%
1 ene 2002 año
72.234
+0.651
0.91%
1 ene 2003 año
72.285
+0.051
0.07%
1 ene 2004 año
72.437
+0.151
0.21%
1 ene 2005 año
72.683
+0.246
0.34%
1 ene 2006 año
72.834
+0.151
0.21%
1 ene 2007 año
73.385
+0.551
0.76%
1 ene 2008 año
73.632
+0.246
0.34%
1 ene 2009 año
73.885
+0.254
0.34%
1 ene 2010 año
73.985
+0.1
0.14%
1 ene 2011 año
74.337
+0.351
0.47%
1 ene 2012 año
74.537
+0.2
0.27%
1 ene 2013 año
74.837
+0.3
0.4%
1 ene 2014 año
75.185
+0.349
0.47%
1 ene 2015 año
75.534
+0.349
0.46%
Ranking de los países por los datos estadísticos actuales