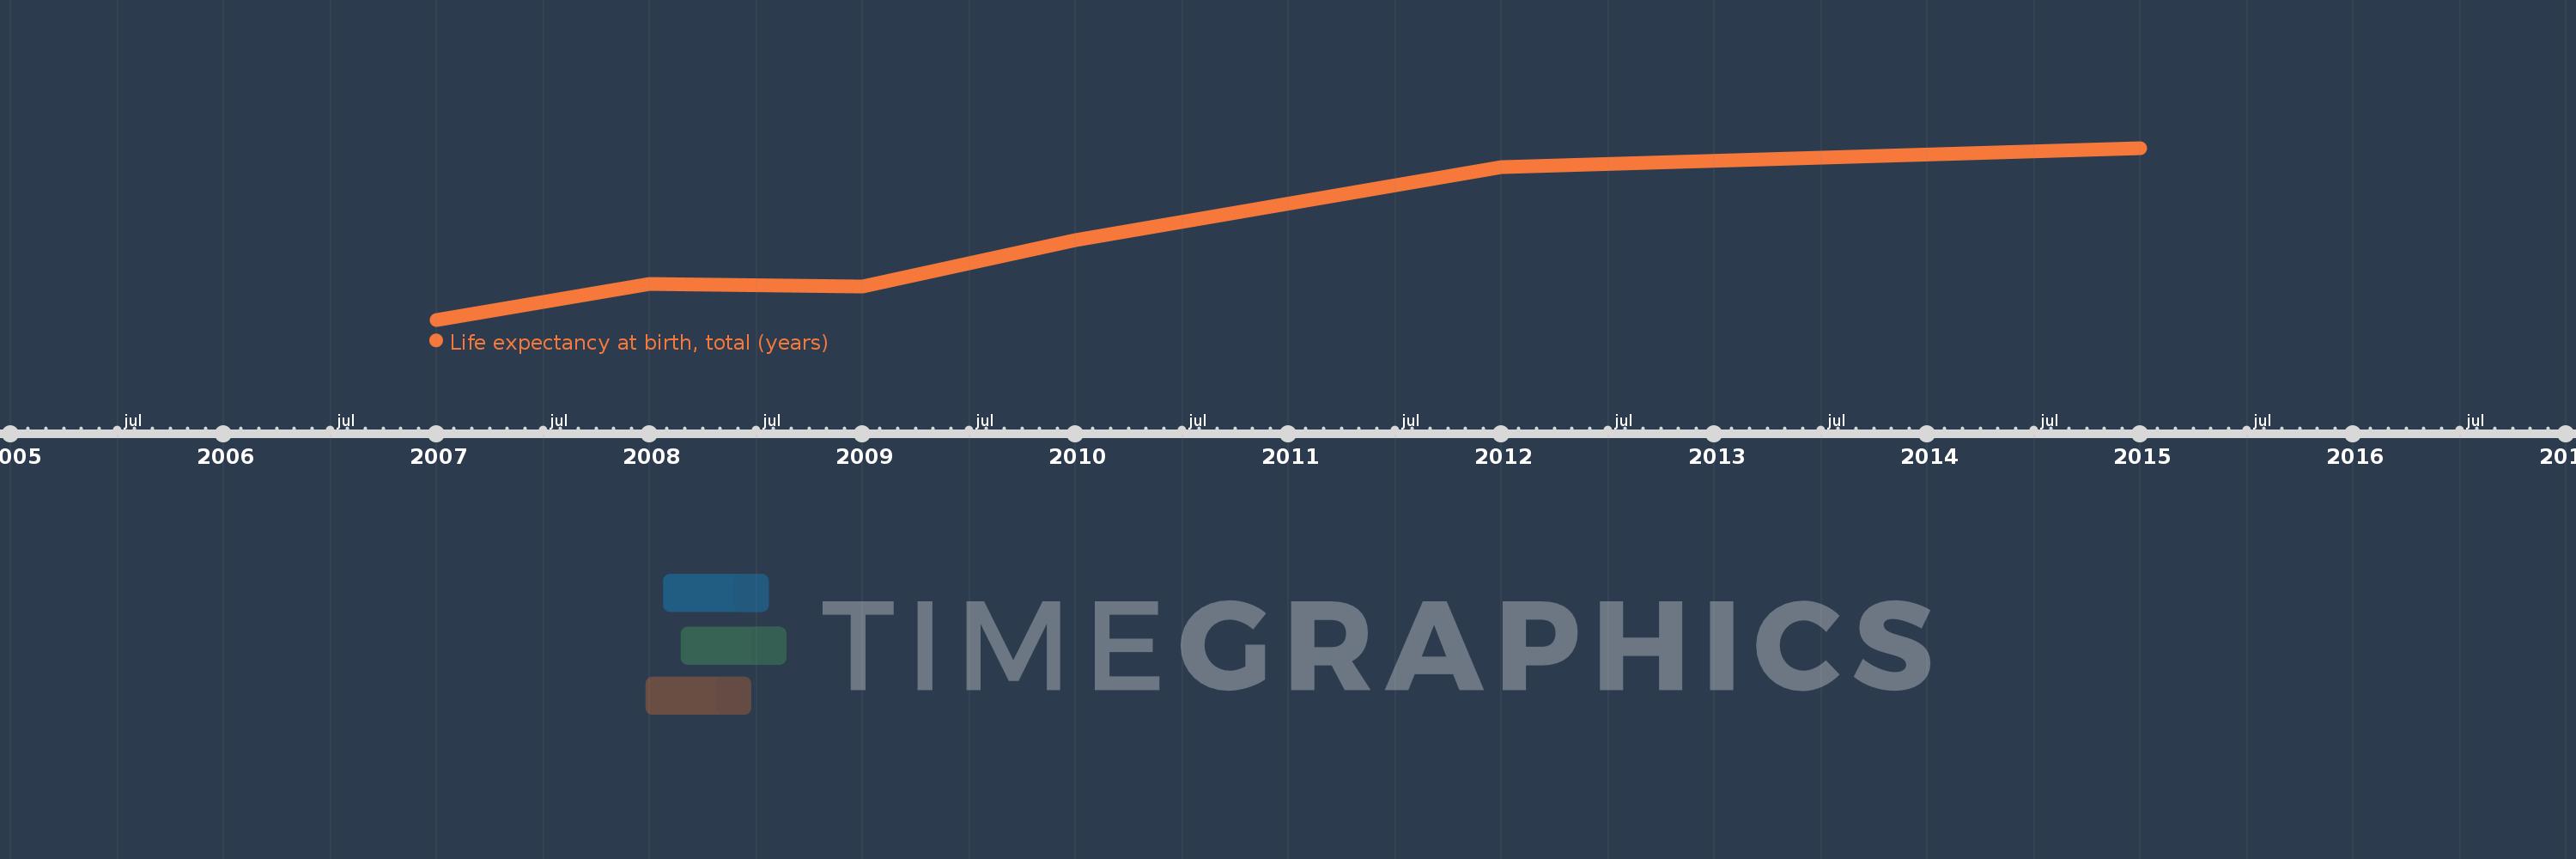
En esta escala de tiempo se presenta un gráfico de 2007 y 2015 de Curacao. Los datos de 2006 están ausentes. El número de observaciones reales por fecha: 6.
Fuente (nombre):
Indicadores del desarrollo mundial
Fuente (organización):
Derived from male and female life expectancy at birth from sources such as: (1) United Nations Population Division. World Population Prospects, (2) Census reports and other statistical publications from national statistical offices, (3) Eurostat: Demographic Statistics, (4) United Nations Statistical Division. Population and Vital Statistics Reprot (various years), (5) U.S. Census Bureau: International Database, and (6) Secretariat of the Pacific Community: Statistics and Demography Programme.
Categorías:
Health
Se ha actualizado:
23 abr 2017 año
Los indicadores de los cambios de valor en los últimos años
En promedio:
76.139
Mínimo:
74.71
1 ene 2007 año
Máximo:
77.824
1 ene 2015 año
A la fecha de observación
Valor
Cambio absoluto
El cambio con respecto al valor anterior
1 ene 2007 año
74.71
+74.71
0.0%
1 ene 2008 año
75.363
+0.654
0.87%
1 ene 2009 año
75.31
-0.054
-0.07%
1 ene 2010 año
76.156
+0.846
1.12%
1 ene 2012 año
77.473
+1.317
1.73%
1 ene 2015 año
77.824
+0.351
0.45%
Ranking de los países por los datos estadísticos actuales