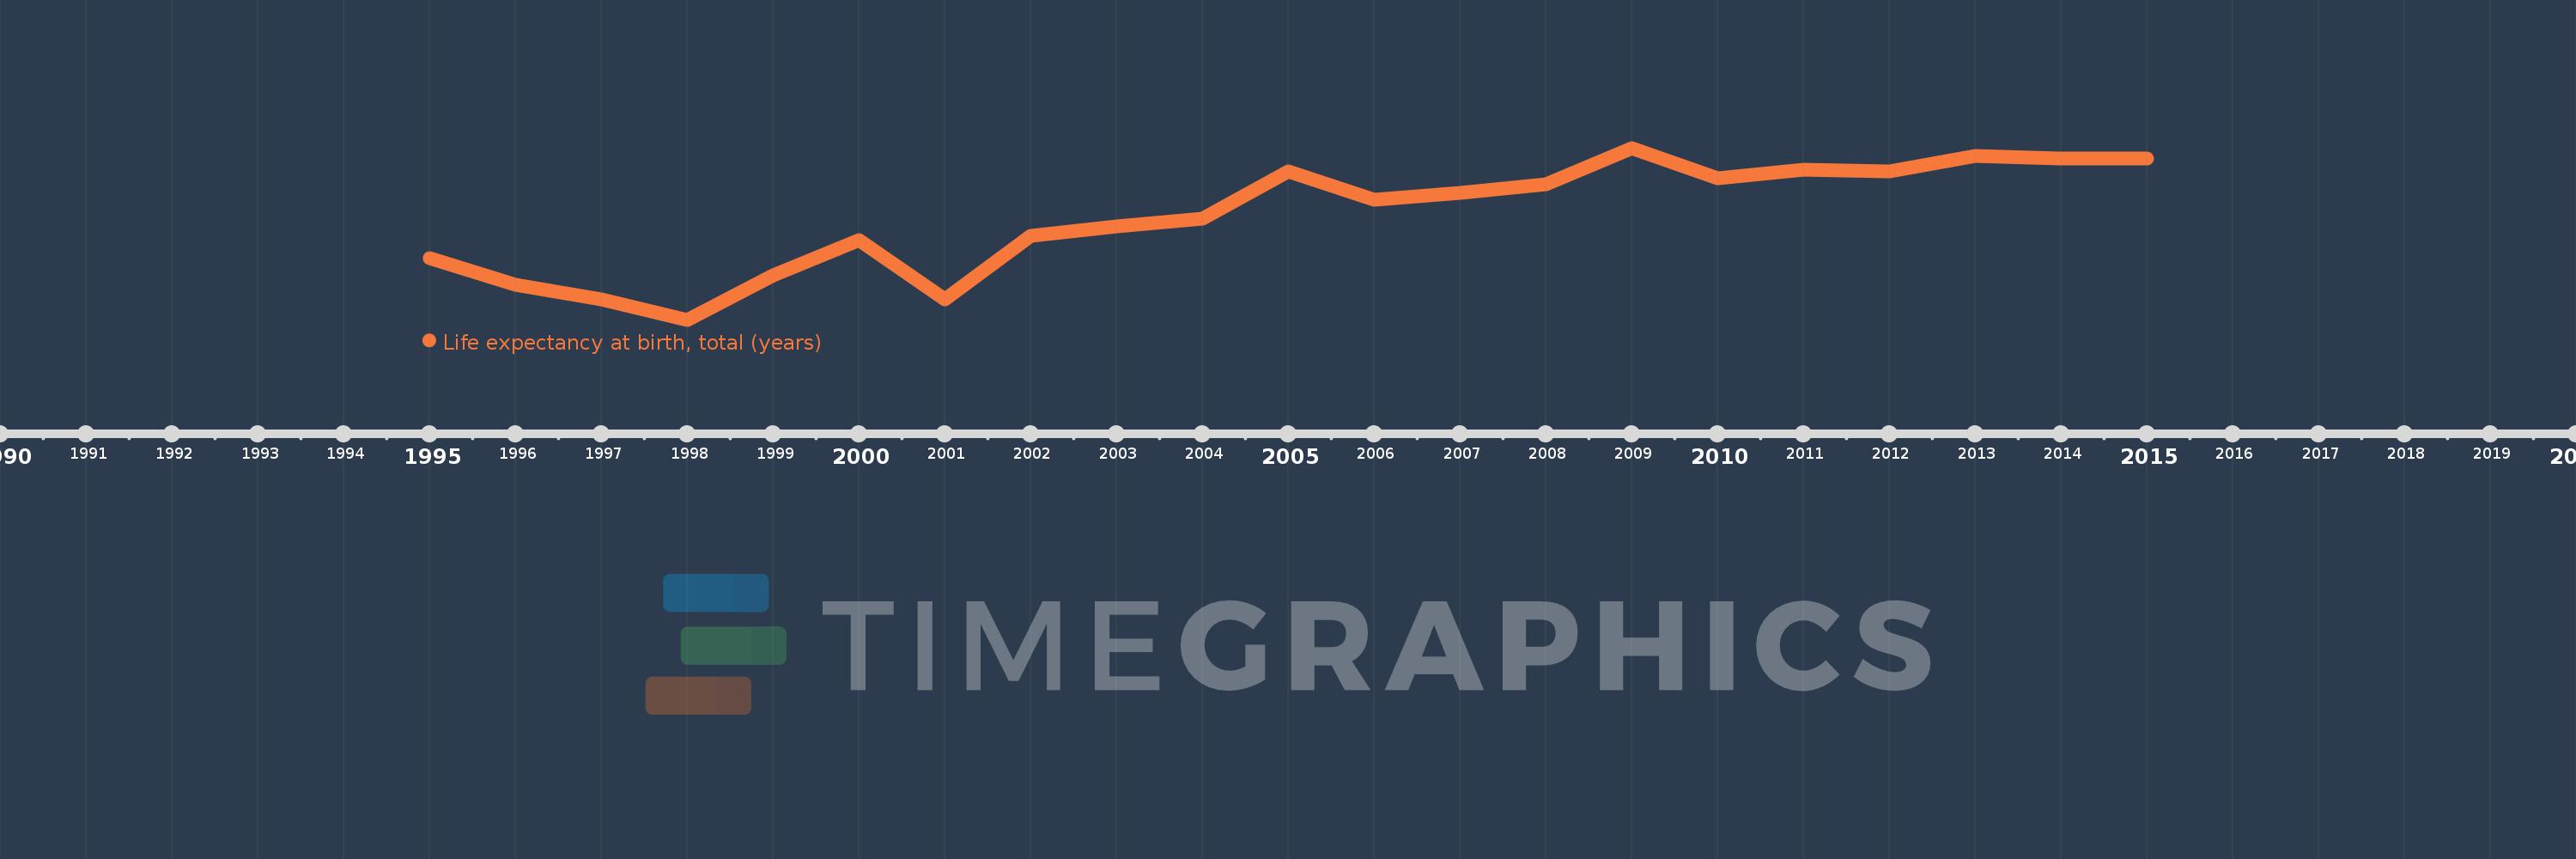
En esta escala de tiempo se presenta un gráfico de 1995 y 2015 de Liechtenstein. Los datos de 1994 están ausentes. El número de observaciones reales por fecha: 21.
Fuente (nombre):
Indicadores del desarrollo mundial
Fuente (organización):
Derived from male and female life expectancy at birth from sources such as: (1) United Nations Population Division. World Population Prospects, (2) Census reports and other statistical publications from national statistical offices, (3) Eurostat: Demographic Statistics, (4) United Nations Statistical Division. Population and Vital Statistics Reprot (various years), (5) U.S. Census Bureau: International Database, and (6) Secretariat of the Pacific Community: Statistics and Demography Programme.
Categorías:
Health
Se ha actualizado:
23 abr 2017 año
Los indicadores de los cambios de valor en los últimos años
En promedio:
80.031
Mínimo:
76.046
1 ene 1998 año
Máximo:
82.683
1 ene 2009 año
A la fecha de observación
Valor
Cambio absoluto
El cambio con respecto al valor anterior
1 ene 1995 año
78.422
+78.422
0.0%
1 ene 1996 año
77.39
-1.032
-1.32%
1 ene 1997 año
76.837
-0.554
-0.72%
1 ene 1998 año
76.046
-0.79
-1.03%
1 ene 1999 año
77.746
+1.7
2.24%
1 ene 2000 año
79.11
+1.363
1.75%
1 ene 2001 año
76.827
-2.283
-2.89%
1 ene 2002 año
79.276
+2.449
3.19%
1 ene 2003 año
79.637
+0.361
0.46%
1 ene 2004 año
79.961
+0.324
0.41%
1 ene 2005 año
81.771
+1.81
2.26%
1 ene 2006 año
80.668
-1.102
-1.35%
1 ene 2007 año
80.949
+0.28
0.35%
1 ene 2008 año
81.295
+0.346
0.43%
1 ene 2009 año
82.683
+1.388
1.71%
1 ene 2010 año
81.5
-1.183
-1.43%
1 ene 2011 año
81.841
+0.341
0.42%
1 ene 2012 año
81.793
-0.049
-0.06%
1 ene 2013 año
82.383
+0.59
0.72%
1 ene 2014 año
82.261
-0.122
-0.15%
1 ene 2015 año
82.261
0.0
0.0%
Ranking de los países por los datos estadísticos actuales