33
/es/
AIzaSyAYiBZKx7MnpbEhh9jyipgxe19OcubqV5w
August 1, 2025
214162
Norway
NOR
true
2
1
Depositors with commercial banks (per 1,000 adults)
2016,2015,2014,2013,2012,2011,2010,2009,2008,2007,2006
Download
Estadísticas Globales de la Biblioteca →Norway →

Depositors with commercial banks (per 1,000 adults)

Estas estadísticas en otros países:

AfghanistanAngolaArab WorldArgentinaAzerbaijanBangladeshBelizeBeninBotswanaBrazilBrunei DarussalamBurkina FasoBurundiCabo VerdeCameroonCentral African RepublicChadChinaColombiaComorosCongo, Dem. Rep.Congo, Rep.Costa RicaCote d'IvoireCroatiaDjiboutiDominican RepublicEarly-demographic dividendEast Asia & Pacific (excluding high income)East Asia & Pacific (IDA & IBRD countries)EcuadorEgypt, Arab Rep.Equatorial GuineaEstoniaEthiopiaFragile and conflict affected situationsGabonGeorgiaGhanaGuineaGuinea-BissauHaitiHeavily indebted poor countries (HIPC)HungaryIBRD onlyIDA & IBRD totalIDA blendIDA onlyIDA totalIsraelItalyKenyaKiribatiKuwaitKyrgyz RepublicLao PDRLatin America & Caribbean (excluding high income)Latin America & the Caribbean (IDA & IBRD countries)LatviaLeast developed countries: UN classificationLebanonLesothoLibyaLow & middle incomeLow incomeLower middle incomeMadagascarMalawiMalaysiaMaldivesMaliMaltaMauritaniaMiddle East & North AfricaMiddle East & North Africa (excluding high income)Middle East & North Africa (IDA & IBRD countries)Middle incomeMoldovaMyanmarNamibiaNigerNigeriaNorwayOther small statesPakistanPalauParaguayPeruPhilippinesPolandPre-demographic dividendQatarRwandaSamoaSan MarinoSao Tome and PrincipeSaudi ArabiaSenegalSeychellesSierra LeoneSingaporeSmall statesSolomon IslandsSouth AsiaSouth Asia (IDA & IBRD)South SudanSub-Saharan Africa Sub-Saharan Africa (excluding high income)Sub-Saharan Africa (IDA & IBRD countries)SurinameSwazilandSyrian Arab RepublicTajikistanTanzaniaThailandTimor-LesteTogoTunisiaTurkeyUgandaUkraineUpper middle incomeUruguayUzbekistanVanuatuVenezuela, RBWest Bank and GazaWorldYemen, Rep.ZambiaZimbabwe

línea de tiempo (timeline):

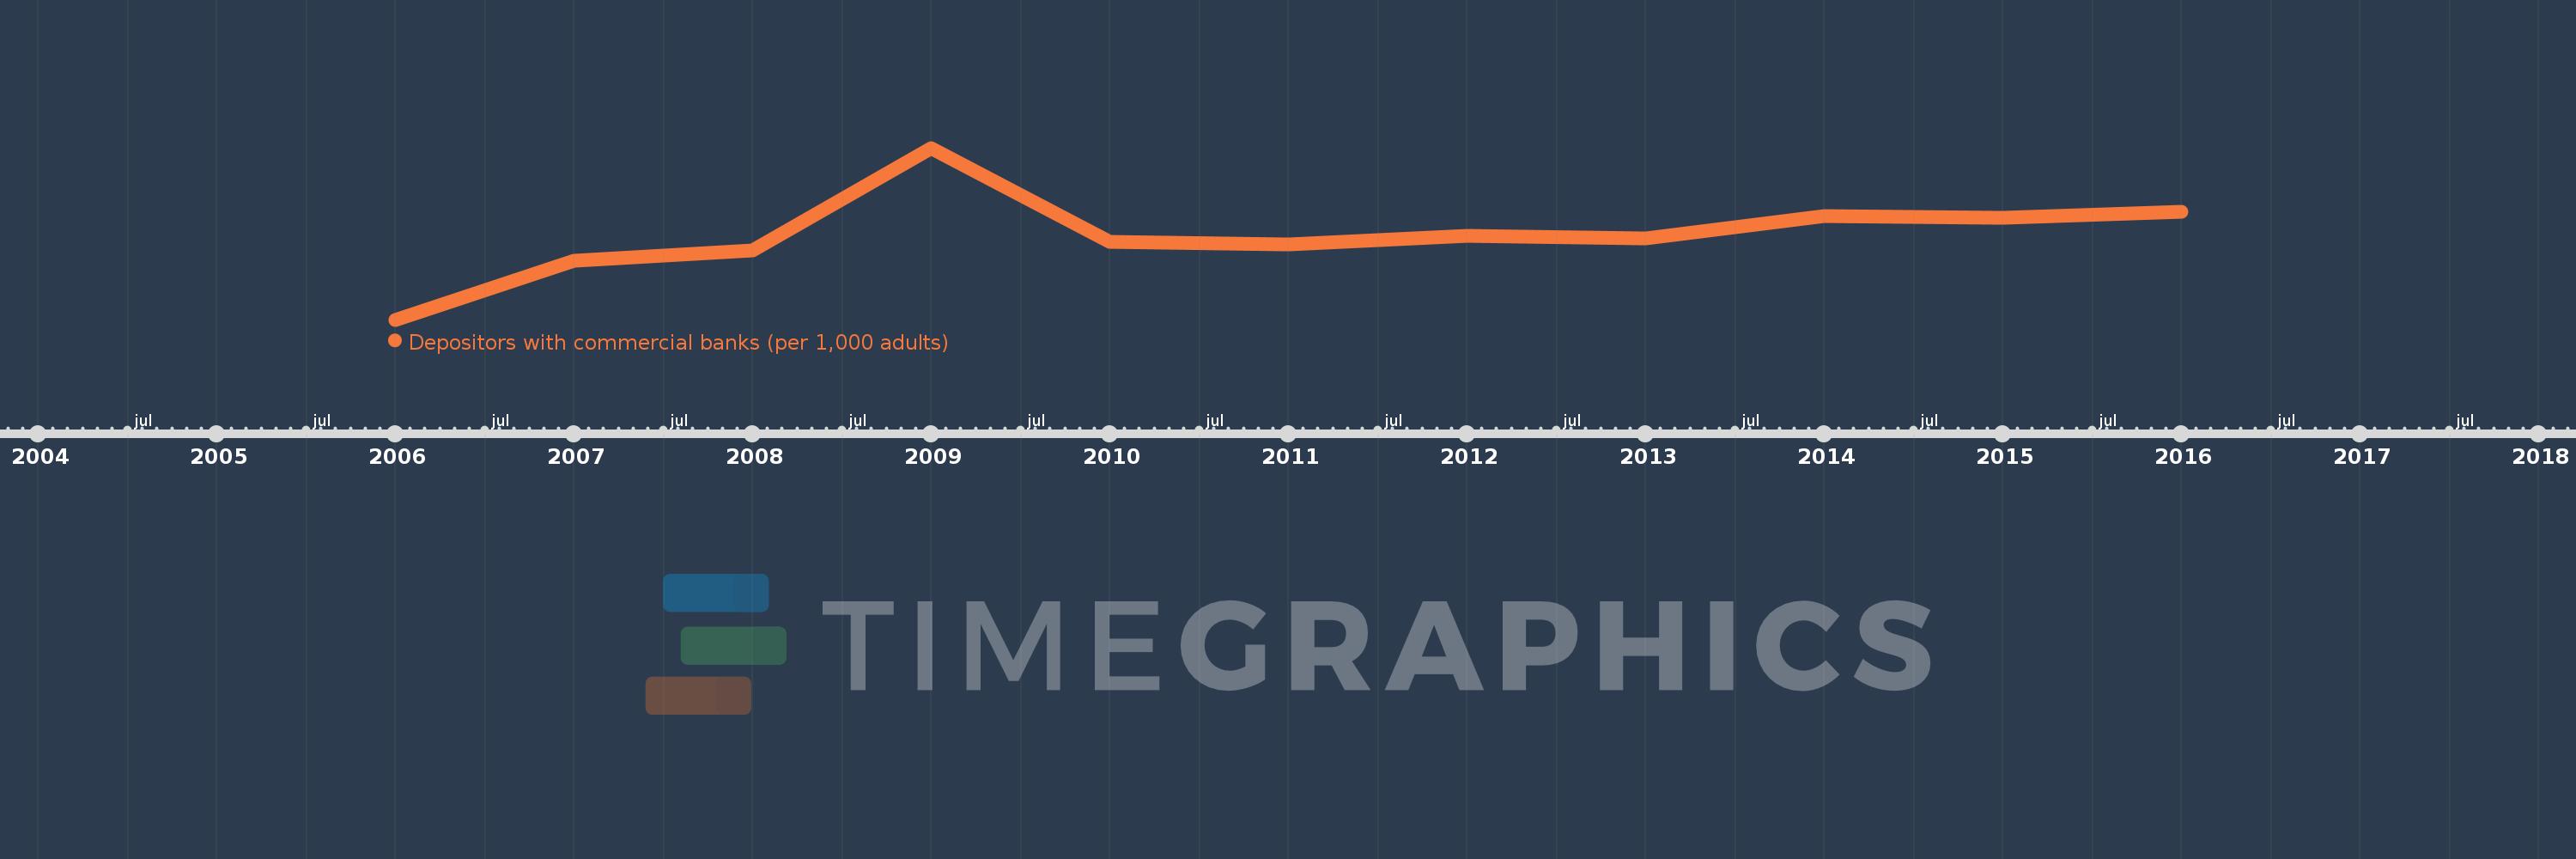
En esta escala de tiempo se presenta un gráfico de 2006 y 2016 de Norway. Los datos de 2005 están ausentes. El número de observaciones reales por fecha: 11.

Fuente (nombre):

Indicadores del desarrollo mundial

Fuente (organización):

International Monetary Fund, Financial Access Survey.

Categorías:

Financial Sector

Se ha actualizado:

23 abr 2017 año

Los indicadores de los cambios de valor en los últimos años

En promedio:
1.173 mil
Mínimo:
967.015
1 ene 2006 año
Máximo:
1.383 mil
1 ene 2009 año
A la fecha de observación
Valor
Cambio absoluto
El cambio con respecto al valor anterior
1 ene 2006 año
967.015
+967.015
0.0%
1 ene 2007 año
1.11 mil
+143.054
14.79%
1 ene 2008 año
1.134 mil
+24.292
2.19%
1 ene 2009 año
1.383 mil
+249.045
21.95%
1 ene 2010 año
1.156 mil
-227.13
-16.42%
1 ene 2011 año
1.15 mil
-6.32
-0.55%
1 ene 2012 año
1.17 mil
+20.415
1.78%
1 ene 2013 año
1.165 mil
-5.414
-0.46%
1 ene 2014 año
1.219 mil
+53.58
4.6%
1 ene 2015 año
1.215 mil
-3.855
-0.32%
1 ene 2016 año
1.228 mil
+13.536
1.11%

Ranking de los países por los datos estadísticos actuales