33
/es/
AIzaSyAYiBZKx7MnpbEhh9jyipgxe19OcubqV5w
August 1, 2025
160339
Israel
ISR
true
2
1
Depositors with commercial banks (per 1,000 adults)
2016,2015,2014,2013,2012,2011,2010,2009
Download
Estadísticas Globales de la Biblioteca →Israel →

Depositors with commercial banks (per 1,000 adults)

Estas estadísticas en otros países:

AfghanistanAngolaArab WorldArgentinaAzerbaijanBangladeshBelizeBeninBotswanaBrazilBrunei DarussalamBurkina FasoBurundiCabo VerdeCameroonCentral African RepublicChadChinaColombiaComorosCongo, Dem. Rep.Congo, Rep.Costa RicaCote d'IvoireCroatiaDjiboutiDominican RepublicEarly-demographic dividendEast Asia & Pacific (excluding high income)East Asia & Pacific (IDA & IBRD countries)EcuadorEgypt, Arab Rep.Equatorial GuineaEstoniaEthiopiaFragile and conflict affected situationsGabonGeorgiaGhanaGuineaGuinea-BissauHaitiHeavily indebted poor countries (HIPC)HungaryIBRD onlyIDA & IBRD totalIDA blendIDA onlyIDA totalIsraelItalyKenyaKiribatiKuwaitKyrgyz RepublicLao PDRLatin America & Caribbean (excluding high income)Latin America & the Caribbean (IDA & IBRD countries)LatviaLeast developed countries: UN classificationLebanonLesothoLibyaLow & middle incomeLow incomeLower middle incomeMadagascarMalawiMalaysiaMaldivesMaliMaltaMauritaniaMiddle East & North AfricaMiddle East & North Africa (excluding high income)Middle East & North Africa (IDA & IBRD countries)Middle incomeMoldovaMyanmarNamibiaNigerNigeriaNorwayOther small statesPakistanPalauParaguayPeruPhilippinesPolandPre-demographic dividendQatarRwandaSamoaSan MarinoSao Tome and PrincipeSaudi ArabiaSenegalSeychellesSierra LeoneSingaporeSmall statesSolomon IslandsSouth AsiaSouth Asia (IDA & IBRD)South SudanSub-Saharan Africa Sub-Saharan Africa (excluding high income)Sub-Saharan Africa (IDA & IBRD countries)SurinameSwazilandSyrian Arab RepublicTajikistanTanzaniaThailandTimor-LesteTogoTunisiaTurkeyUgandaUkraineUpper middle incomeUruguayUzbekistanVanuatuVenezuela, RBWest Bank and GazaWorldYemen, Rep.ZambiaZimbabwe

línea de tiempo (timeline):

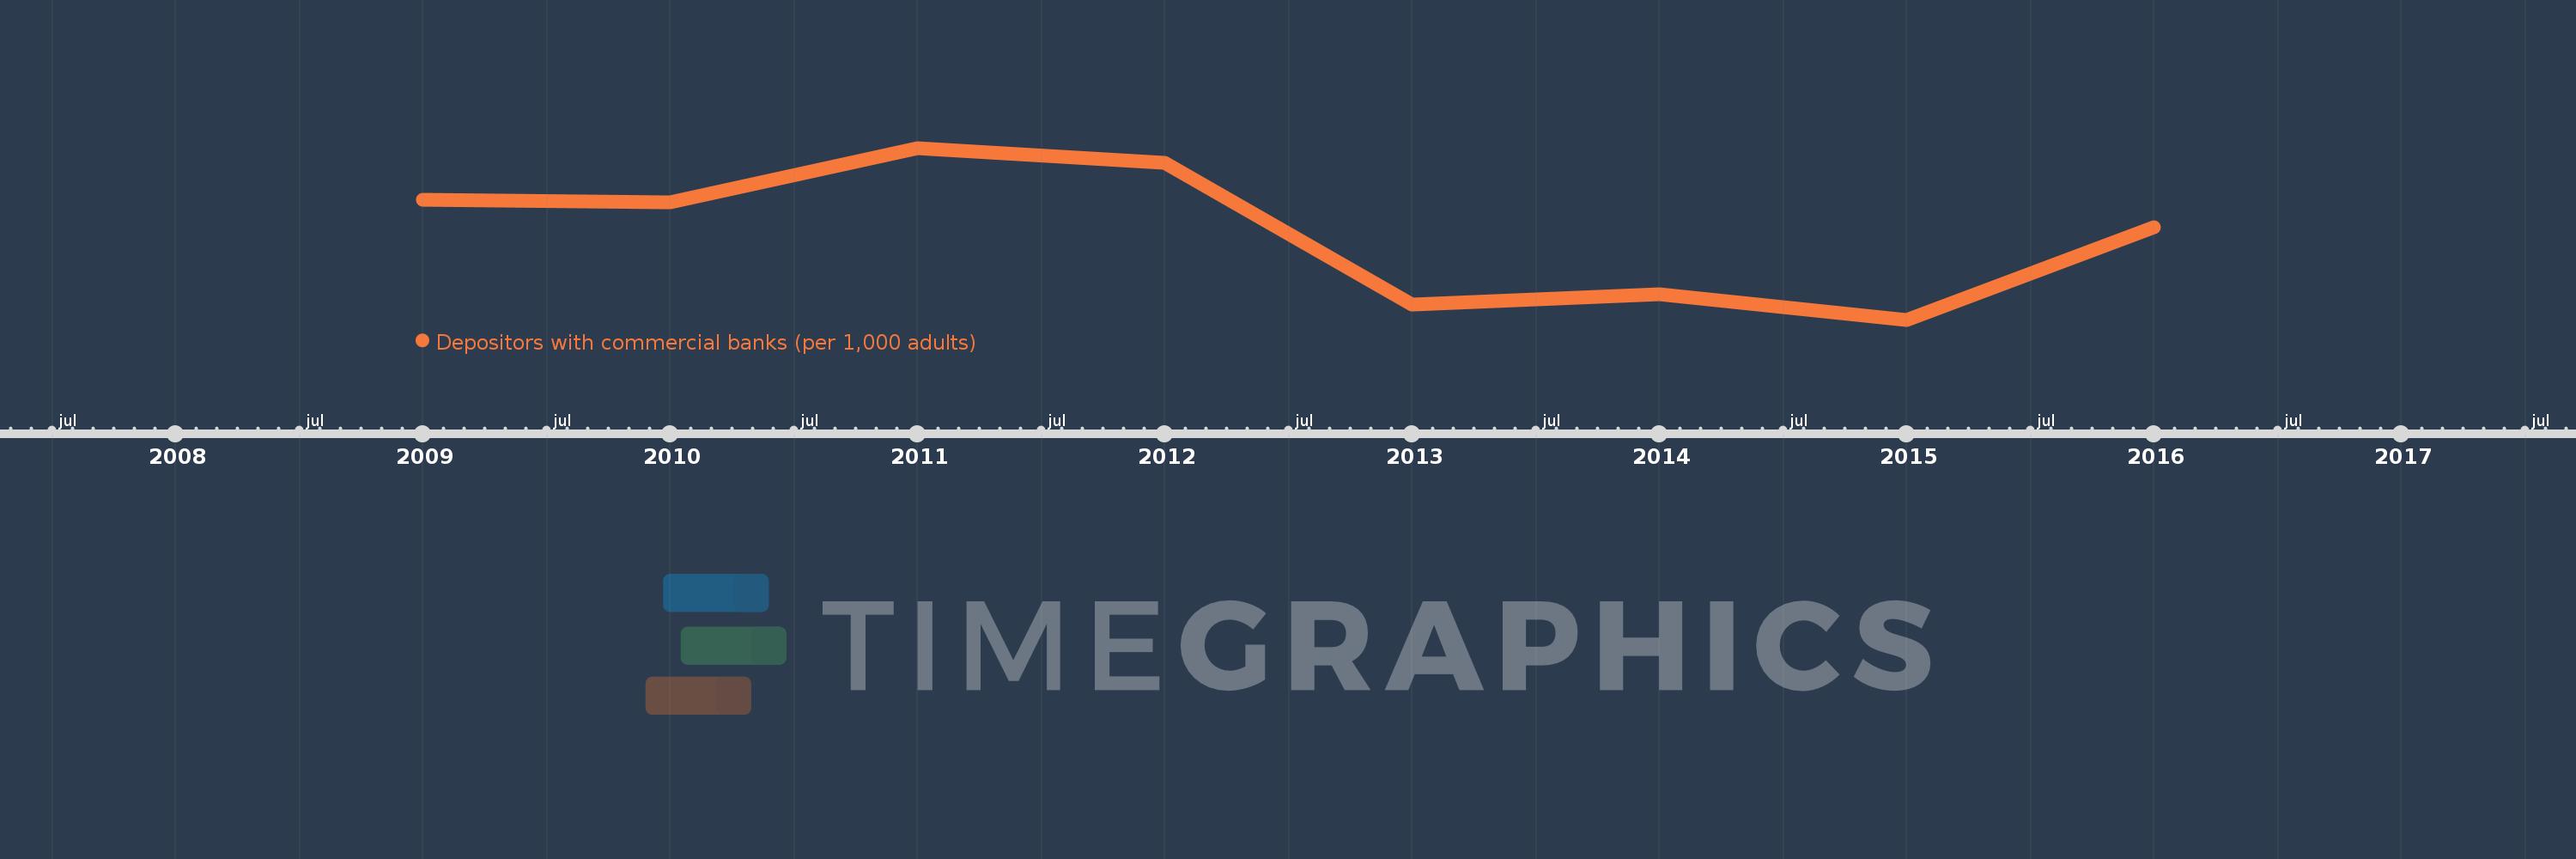
En esta escala de tiempo se presenta un gráfico de 2009 y 2016 de Israel. Los datos de 2008 están ausentes. El número de observaciones reales por fecha: 8.

Fuente (nombre):

Indicadores del desarrollo mundial

Fuente (organización):

International Monetary Fund, Financial Access Survey.

Categorías:

Financial Sector

Se ha actualizado:

23 abr 2017 año

Los indicadores de los cambios de valor en los últimos años

En promedio:
1.0 mil
Mínimo:
931.468
1 ene 2015 año
Máximo:
1.067 mil
1 ene 2011 año
A la fecha de observación
Valor
Cambio absoluto
El cambio con respecto al valor anterior
1 ene 2009 año
1.026 mil
+1.026 mil
0.0%
1 ene 2010 año
1.024 mil
-1.931
-0.19%
1 ene 2011 año
1.067 mil
+42.499
4.15%
1 ene 2012 año
1.055 mil
-11.938
-1.12%
1 ene 2013 año
943.725
-110.899
-10.52%
1 ene 2014 año
951.677
+7.952
0.84%
1 ene 2015 año
931.468
-20.208
-2.12%
1 ene 2016 año
1.004 mil
+72.527
7.79%

Ranking de los países por los datos estadísticos actuales