29
/es/
es
AIzaSyAYiBZKx7MnpbEhh9jyipgxe19OcubqV5w
April 1, 2024
146730
Guinea-Bissau
GNB
true
2
1
Depositors with commercial banks (per 1,000 adults)
2016,2015,2014,2013,2012,2011,2010,2009,2008,2007,2006,2005
Download
Estadísticas Globales de la Biblioteca →Guinea-Bissau →

Depositors with commercial banks (per 1,000 adults)

Estas estadísticas en otros países:
AfghanistanAngolaArab WorldArgentinaAzerbaijanBangladeshBelizeBeninBotswanaBrazilBrunei DarussalamBurkina FasoBurundiCabo VerdeCameroonCentral African RepublicChadChinaColombiaComorosCongo, Dem. Rep.Congo, Rep.Costa RicaCote d'IvoireCroatiaDjiboutiDominican RepublicEarly-demographic dividendEast Asia & Pacific (excluding high income)East Asia & Pacific (IDA & IBRD countries)EcuadorEgypt, Arab Rep.Equatorial GuineaEstoniaEthiopiaFragile and conflict affected situationsGabonGeorgiaGhanaGuineaGuinea-BissauHaitiHeavily indebted poor countries (HIPC)HungaryIBRD onlyIDA & IBRD totalIDA blendIDA onlyIDA totalIsraelItalyKenyaKiribatiKuwaitKyrgyz RepublicLao PDRLatin America & Caribbean (excluding high income)Latin America & the Caribbean (IDA & IBRD countries)LatviaLeast developed countries: UN classificationLebanonLesothoLibyaLow & middle incomeLow incomeLower middle incomeMadagascarMalawiMalaysiaMaldivesMaliMaltaMauritaniaMiddle East & North AfricaMiddle East & North Africa (excluding high income)Middle East & North Africa (IDA & IBRD countries)Middle incomeMoldovaMyanmarNamibiaNigerNigeriaNorwayOther small statesPakistanPalauParaguayPeruPhilippinesPolandPre-demographic dividendQatarRwandaSamoaSan MarinoSao Tome and PrincipeSaudi ArabiaSenegalSeychellesSierra LeoneSingaporeSmall statesSolomon IslandsSouth AsiaSouth Asia (IDA & IBRD)South SudanSub-Saharan Africa Sub-Saharan Africa (excluding high income)Sub-Saharan Africa (IDA & IBRD countries)SurinameSwazilandSyrian Arab RepublicTajikistanTanzaniaThailandTimor-LesteTogoTunisiaTurkeyUgandaUkraineUpper middle incomeUruguayUzbekistanVanuatuVenezuela, RBWest Bank and GazaWorldYemen, Rep.ZambiaZimbabwe
línea de tiempo (timeline):
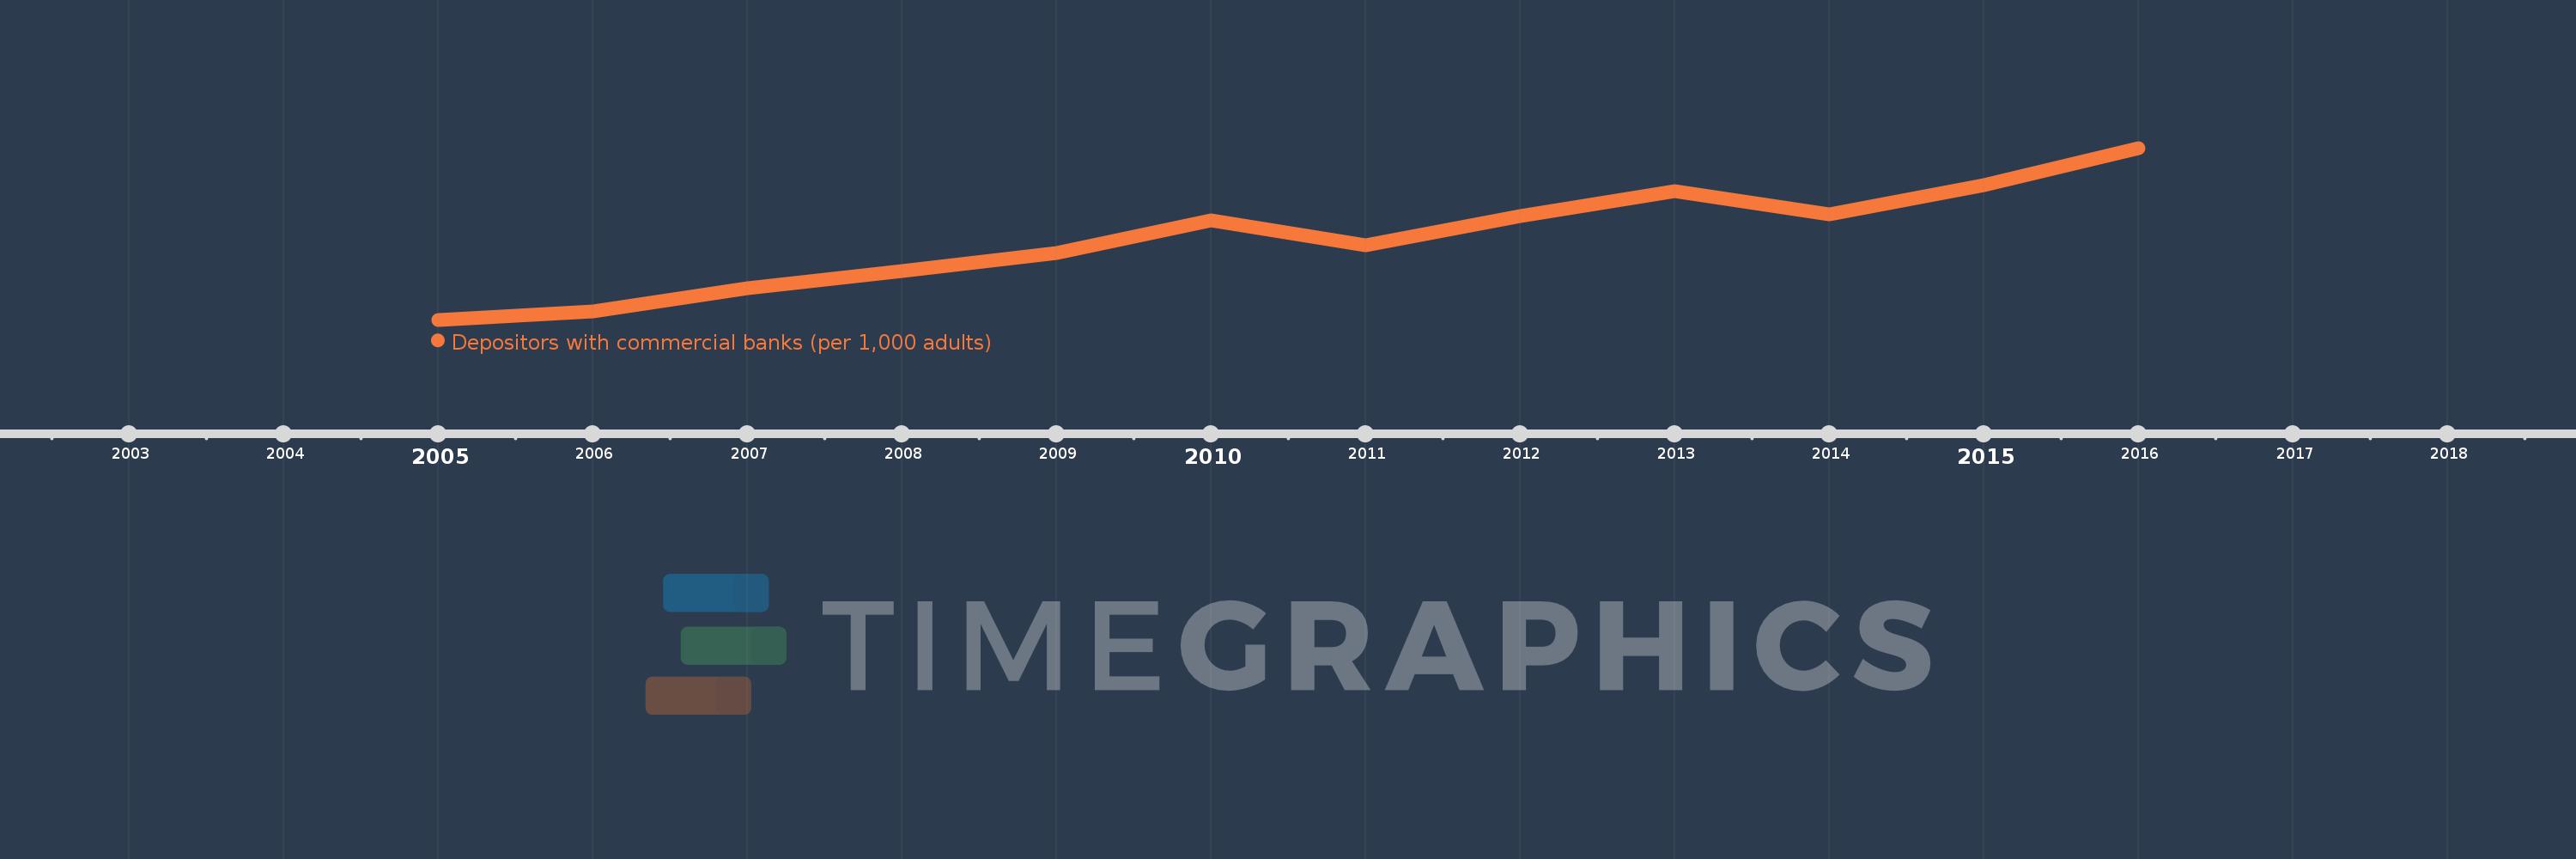
En esta escala de tiempo se presenta un gráfico de 2005 y 2016 de Guinea-Bissau. Los datos de 2004 están ausentes. El número de observaciones reales por fecha: 12.
Fuente (nombre):
Indicadores del desarrollo mundial
Fuente (organización):
International Monetary Fund, Financial Access Survey.
Categorías:
Financial Sector
Se ha actualizado:
23 abr 2017 año
Los indicadores de los cambios de valor en los últimos años
En promedio:
46.696
Mínimo:
8.496
1 ene 2005 año
Máximo:
89.461
1 ene 2016 año
A la fecha de observación
Valor
Cambio absoluto
El cambio con respecto al valor anterior
1 ene 2005 año
8.496
+8.496
0.0%
1 ene 2006 año
12.352
+3.856
45.39%
1 ene 2007 año
23.207
+10.855
87.88%
1 ene 2008 año
31.404
+8.196
35.32%
1 ene 2009 año
40.092
+8.688
27.67%
1 ene 2010 año
55.443
+15.352
38.29%
1 ene 2011 año
43.498
-11.945
-21.54%
1 ene 2012 año
57.223
+13.724
31.55%
1 ene 2013 año
69.077
+11.855
20.72%
1 ene 2014 año
58.103
-10.975
-15.89%
1 ene 2015 año
71.992
+13.889
23.9%
1 ene 2016 año
89.461
+17.469
24.27%
Ranking de los países por los datos estadísticos actuales

Comentarios:

Enviar
PremiumAbout & FeedbackAcuerdoPrivacidad
logo
© 2022 Selected Technologies LLC – Morgan Hill, California